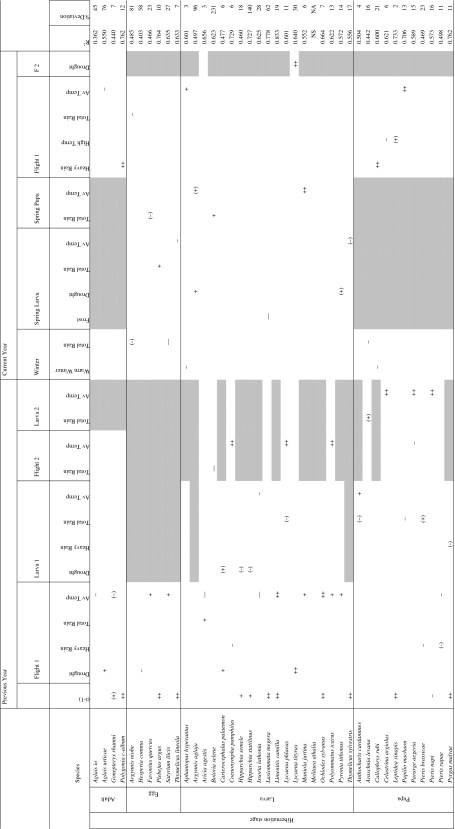
Table 1.
Significant weather variables included in the stepwise regression analysis to explain annual changes in the population index of butterfly species
++ or −−, P < 0.01; + or −, P < 0.05; (+) or (−), P < 0.10; NS (not significant), P > 0.10
F2 Second flight period; NA not applicable
t-1 represents the population index in the previous year as a measure of density dependence; R 2 gives the proportion of explained variation by the regression model; % Deviation denotes the mean absolute relative difference between observed and predicted population index values over 4 years of validation
Grey-shaded cells do not apply to the species concerned

