Abstract
Chronic use of cocaine is associated with lasting alterations in brain metabolism, circuitry and receptor properties. We used neuroimaging with pharmacologic MRI (phMRI) to assess alterations in response to cocaine (0.5mg/kg) in animals trained to self-administer (SA) cocaine on a fixed-ratio 5 schedule of reinforcement, as well as saline-yoked controls, after 28 days of cocaine abstinence. We fit the cerebral blood volume (CBV) curves for full-width half-maximum (FWHM) as well as peak CBV response. There were significant increases in the FWHM of the response curves in the cocaine-SA animals compared to saline-yoked controls in medial-prefrontal cortex (mPFC) and caudate/putamenm (CPu) and increases in peak CBV in M1 motor cortex, CPu and pedunculopontine tegmental nucleus. Functional connectivity analysis showed increased correlations in the SA rats upon acute cocaine challenge, especially in the S1, mPFC, and thalamus. Since D3 receptors are postulated to increase following chronic cocaine administration we also examined the response to 0.2 mg/kg of the D3 preferring agonist 7-OHDPAT. Cocaine SA animals showed a decreased overall CBV response to this drug, except in the globus pallidus. The hypothalamus showed a negative CBV change in response to cocaine challenge similar to that noted with the D3 agonist and showed a smaller response in the cocaine-SA animals than the controls. Given the good coupling of cerebral hemodynamics with dopamine dynamics previously observed with phMRI, these data suggest that increased persistence of dopamine in prefrontal cortex may be responsible for some of the behavioral alterations observed subsequent to chronic cocaine use.
Keywords: MRI, dopamine neurons, cerebral blood volume, receptors, addiction
Introduction
Chronic use of cocaine can lead to enduring alterations in brain circuitry including both limbic elements such as the nucleus accumbens (NAc) and medial prefrontal cortex (mPFC) as well as alterations in motor circuitry (Schmidt et al., 2005; Thomas et al., 2008; Koob, 2009). This chronic use can also lead to alterations in cerebral blood flow and metabolism (Volkow et al., 2000; Volkow et al., 2009) and as well to alterations in receptor densities and/or binding constants. Prior evidence in primates as well as rodents shows that chronic cocaine can lead to decreases in dopamine (DA) D2 receptor binding (Volkow et al., 2004; Nader et al., 2006) and further, that decreased basal D2 tone in primates (caused for instance by social subordination (Morgan et al., 2002; Nader & Czoty, 2005; Nader et al., 2008) or in rodents (associated with high impulsivity (Perry et al., 2005) can predispose animals to higher cocaine intake. There is also evidence for upregulation of D3 receptors following chronic cocaine intake in rodents (Neisewander et al., 2004) or following cocaine overdoses in humans (Staley & Mash, 1996).
Magnetic resonance imaging can provide maps of brain activity across the whole brain associated with stimulation of drugs such as cocaine (Chen et al., 1996; Breiter et al., 1997; Chen et al., 1997; Marota et al., 2000; Mandeville et al., 2004; Schwarz et al., 2004; Choi et al., 2006; Luo et al., 2009). The response of a given brain region to a drug such as cocaine or amphetamine is associated with both positive and negative hemodynamic changes reflected in either BOLD, cerebral blood flow (CBF) or cerebral blood volume (CBV) measures. We have previously shown for dopaminergic drugs, that decreased CBV is associated with agonism of D2/D3 receptors and that increased CBV is associated with D1/D5 receptor agonism (Chen et al., 2005; Choi et al., 2006). Therefore the ability to probe D1/D5 and D2/D3 receptor function using MRI provides a useful tool for examining the function of these receptors as opposed to the static picture generated using either Positron emission tomography (PET) or autoradiography studies of ligand binding. This points out one of the fundamental strengths of the MRI experiments that not only does one get a map, but also a time course, and this time course, in the case of drugs such as cocaine or amphetamine, can be associated with the time course of DA in the brain (Chen et al., 1997; Chen et al., 2005; Choi et al., 2006).
In this manuscript we examined the response to both a cocaine challenge as well as a challenge to a D3-preferring agonist 7-hydroxy-NN-di-r-propyl-2-aminotetralin (7-OHDPAT) in animals trained to self-administer (SA) cocaine and saline-yoked controls. In particular we wished to determine what alterations might be observed in the mPFC – limbic circuitry including the nucleus accumbens and pedunculopontine tegmental nucleus (PPTg). We recently showed that the latter region is strongly involved in the limbic circuitry associated with cocaine reinstatement (Schmidt et al., 2009). Therefore we postulated that there would be an increased response to cocaine in the limbic circuitry defined by the mPFC – NAc - PPTg in the cocaine SA animals. We further postulated that we would be able to see alterations in the D3 receptor circuitry as a consequence of cocaine self-administration.
Methods
Animals and Housing
Male Sprague Dawley rats (Rattus norvegicus) weighing 250-300 g were obtained from Taconic Laboratories (Germantown, N.Y., USA). Animals were single-housed with food and water available ad libitum. All animals were housed in a colony maintained on a 12-hr/12-hr light/dark cycle with the lights on at 7:00 a.m. All experimental procedures were performed during the light phase. All experimental protocols were in accordance with the guidelines set forth by the National Institutes of Health and were approved by the Boston University School of Medicine and Massachusetts General Hospital Institutional Animal Care and Use Committee.
Surgery
Rats were allowed one week to acclimate to their home cages upon arrival. Prior to surgery, the rats were anesthetized with 80 mg/kg ketamine and 12 mg/kg xylazine (Sigma/RBI, St. Louis, MO). An indwelling catheter (CamCaths; Cambridge, UK) was inserted into the right, external jugular vein and sutured securely in place. The catheter was connected to a mesh backmount, which was implanted subcutaneously above the shoulder blades. In order to prevent infection and to maintain patency, catheters were flushed daily with 0.3 ml of a solution of the antibiotic Timentin (ticarcillin disodium/potassium clavulanate, 0.93 mg/ml) dissolved in heparinized saline. When not in use, the catheters were sealed with plastic obturators.
Cocaine Self-Administration (SA)
After surgery, rats were allowed seven days to recover before behavioral testing commenced. Initially, rats were placed in operant chambers daily and allowed to lever press for intravenous cocaine (0.25 mg cocaine/59 μl saline, infused over a 5 sec period) on a fixed-ratio 1 (FR1) schedule of reinforcement. Each session began with the i.v. administration of 59 μl cocaine (0.25 mg) to fill the catheter. Rats were allowed to self-administer a maximum of 30 injections per 120-minute operant session. Stable responding on the fixed ratio one (FR1) schedule was defined as less than 15% variation in response rates over three consecutive self-administration days. After stable responding was achieved, animals were switched to a fixed-ratio five (FR5) schedule of reinforcement. The maximum number of injections was again limited to 30 per daily self-administration session under the FR5 schedule. For both the FR1 and FR5 schedules, a 20 second time-out period followed each cocaine infusion, during which time active lever responses were tabulated but had no scheduled consequences. The total doses that were self-administered for the rats we scanned were between 6-7 mg/session, for a total of approximately 150mg/rat.
In this experiment, rats were randomly assigned to one of two groups: cocaine-experimental or saline-yoked. Each rat trained to respond for contingent cocaine infusions (cocaine-experimental) was paired with a yoked subject that received infusions of saline. Responses on the inactive lever were not reinforced for the experimental cocaine rat. Lever pressing for the saline-yoked rats had no scheduled consequences, but these animals received the same number and temporal pattern of infusions as self-administered by the paired cocaine-experimental rat. After 21 days of operant training, rats experienced 28 days of forced drug abstinence (spent in home cages), a length of time equivalent to the combined extinction and reinstatement phases of the behavioral studies from the same cohort of animals that were not scanned described in Schmidt et al. (Schmidt et al., 2009). Following this period of forced drug abstinence, rats underwent imaging.
Imaging studies
The animals were ventilated to maintain pCO2 in a normal physiological range (35-45 mmHg) during the imaging session. Scanning took place under halothane anesthesia (1.2%) and intravenous infusion of pancuronium bromide (2mg/kg/hr) for muscle paralyzation. The tail vein was catheterized for both contrast agent and drug administration. Body temperature was regulated using a circulating warm-water blanket set to 37°C. Arterial blood gas sampling and blood pressure were measured by catheterization of the femoral artery. Blood gases were taken periodically before and during imaging while blood pressure was measured continuously throughout the session. Animals were scanned in a 9.4T magnet (Bruker Instruments, Billerica, MA) using the IRON (Increased Relaxation for Optimized Neuroimaging) technique to generate maps of relative cerebral blood volume (CBV) (Chen et al., 2001). Iron oxide contrast agent was injected through a tail vein to sensitize the images to CBV as described previously (Chen et al., 2001; Mandeville et al., 2001; Mandeville et al., 2004). Briefly, a dextran-coated supramagnetic intravascular contrast agent of monocrystalline iron oxide nanoparticles (MION, 15 mg/kg) was administered after 15 baseline images. Then continuous imaging was performed to attain a post-MION baseline (150 time points) before cocaine administration. The cocaine challenge injection was administered through a tail vein as a bolus (0.5 mg/kg, i.v.). Contiguous coronal slices (180 time points) were obtained for each time point using conventional gradient echo planar images with 16 segments, a field of view (FOV) of 30mm, and 96×96 resolution with 0.75mm slice thickness, and a TR/TE of 625/8ms. Temporal resolution was 10s per time point.
We administered 0.5mg/kg of cocaine since prior studies indicated that this produces a robust response of CBV, and this closely matches the total dose administered for each of the lever presses during the self-administration described above. In order to probe functional alterations in D3 receptors we used the selective D3 agonist 7-OHDPAT that was administered 60 min after cocaine. At this time point cocaine effects have recovered to baseline for CBV and the lifetime for cocaine in the rat brain is about 20 min (Du et al., 2009). In macaques and Sprague-Dawley rats, our PET data shows that tracer level doses of cocaine are back to baseline in about 40 min, quite similar to what has been reported in humans (Telang et al., 1999). Further studies with much larger doses in mice (20 mg/kg i.p.) show recovery to baseline concentrations by 60 min (Azar et al., 1998) similar to that seen in rats by Carmona et al. using 17 mg/kg i.p (Carmona et al., 2005). These studies show a t1/2 for clearance, at these high doses, of about 26 min. Our microdialysis studies in rats show that extracellular fluid (ECF) DA levels return to baseline in less than 40 min when using 0.5mg/kg i.v. (Chen et al., 2010), this is similar to the DA kinetics reported by others using microdialysis (Othman et al., 2007). Therefore the 60 min interval we chose was to allow for clearance of cocaine and DA, but to minimize the time spent under anesthesia. For the 7-OHDPAT the rationale for the dose was to use a dose that evokes strong behavioral effects and also evokes strong alterations in cerebral blood volume, but still shows selectivity for D3 over D2 receptors. We recently published an extensive investigation of the dose-dependence of 7-OHDPAT in naïve rats and that study (Choi et al., 2010), consistent with other data from Levant’s group (Levant et al., 1996), shows that the 0.2mg/kg is still relatively selective for D3 over D2R.
All images were registered onto the same standard brain template for subsequent averaging across animals using an automatic routine developed by Dr. JB Mandeville. Registration between the functional image set and the standard template was performed by adjusting 12 registration variables (3 translations, 3 rotation angles, 3 skew (non-rigid) angles and 3 inflations on the 3 major planes.
The imaging data were analyzed by conversion of changes in signal intensity to CBV values. Images were aligned to a template and regions of interest (ROI) were drawn from a registered atlas (Paxinos & Watson, 1997). The CBV time courses from the ROIs were fit to gamma variate functions using a general linear model and statistical maps were corrected for the total numbers of voxels fit for in the image in the brain only. Maps were constructed for both the self-administering animals as well as the saline-yoked controls of the following: significant changes in CBV, peak CBV values, the full width half maximum (FWHM) of the gamma variate function, and the contrast between all these functions in the self-administering as well as saline animals.
Statistical comparisons of the alterations in mean peak CBV values and FWHM of the curves fit for each of the cocaine SA and saline-yoked animals were compared for each ROI reported were made using a one-way ANOVA.
Seed-based functional connectivity analysis was carried out on the set of CBV study with acute cocaine challenge. CBV temporal profiles from selected seeding areas were used as basis functions (temporally detrained) for correlation analysis through the whole brain on a pixel-by-pixel basis (AFNI 3dDeconvolve). Functional connectivity associated with cocaine challenge was obatined using the contextual dependent approach to deconvolve functional connectivity from the basal resting period. The seeding areas included the following brain areas: CPu (anterial, lateral, and dorsosuperioral portions), M1, S1, S2, mPFC (including cingulate cortex I, cingulate cortex II, prelimbic cortex), thalamus (central portion, and ventroposterior/ventromedial protion), and insular cortex.
Results
CBV response to cocaine challenge
We examined the response to cocaine stimulus (0.5mg/kg, i.v.) in animals trained to self-administer cocaine as well as saline-yoked controls three weeks after their last self-administration session. In both groups, cocaine induces a biphasic signal change with an early negative CBV response followed by a larger positive response. The negative “early-dip” is larger in areas of the brain with the highest expression of DA receptors including nucleus accumbens and caudate/putamen (CPu). Such a map is shown for the cocaine-SA animals and saline-yoked animals in Fig. 1 with the fits to the negative and positive CBV components. Since D2/D3 receptor agonism induces negative CBV changes and D1/D5 receptor agonism induces positive CBV changes (Chen et al., 2005; Choi et al., 2006) these two components likely represent the response of these two receptor systems. Overall, the pattern of response to the cocaine challenge is reasonably similar between the cocaine SA and saline-yoked controls as shown in the maps in Fig. 1. However, there were significant differences in a number of brain regions. We utilized an ROI-based approach to data analysis comparing the peak CBV changes and alterations in FWHM for the ROIs. The group data are reported in Table 1. Comparisons between the cocaine SA and saline-yoked animals for the brain regions showing significant differences in the two groups are shown in Figs. 2-5. We made maps of significant changes in peak CBV change and FWHM using subtractions between the cocaine SA and saline-yoked animals and also plotted the time course for changes in CBV (for more detail see Methods). There were significant increases in FWHM in dorsolateral (motor) CPu (F1,11 = 7.26; P<0.05) and mPFC (F1,11 = 5.07; P<0.05) (Figs 2 and 3) with trends toward increase FWHM in hippocampus and nucleus accumbens (see Table 1) and increases in peak CBV in dorsolateral CPu (F1,11 = 5.16; P<0.05; Fig. 2), M1 motor cortex (F1,11 = 7.58; P<0.05; Fig. 4), and PPTg (F1,11 = 7.26; P<0.05; Fig. 5). Interestingly, in the hypothalamus cocaine induces a monotonic negative CBV change (Fig. 6). Due to the shape of the curve we did not fit for FWHM but rather integrated the CBV change from either 1-10 min or from 4-10 min. In either case, there was a significant difference between the cocaine SA and saline-yoked controls with the cocaine SA animals having the smaller response (for cocaine SA vs. saline controls respectively the CBV changes were: from 1-10min -4.8±0.8 vs. -9.0 ± 1.5 p<0.05 or from 4-10min -5.1±0.8 vs. -9.4±1.8 p <0.05). The hypothalamic signal may represent D3 receptor mediated signal change as suggested by our recent data with D3 receptors (Choi et al., 2010) as well as the data shown below for challenge with a D3 preferring agonist.
Figure 1.
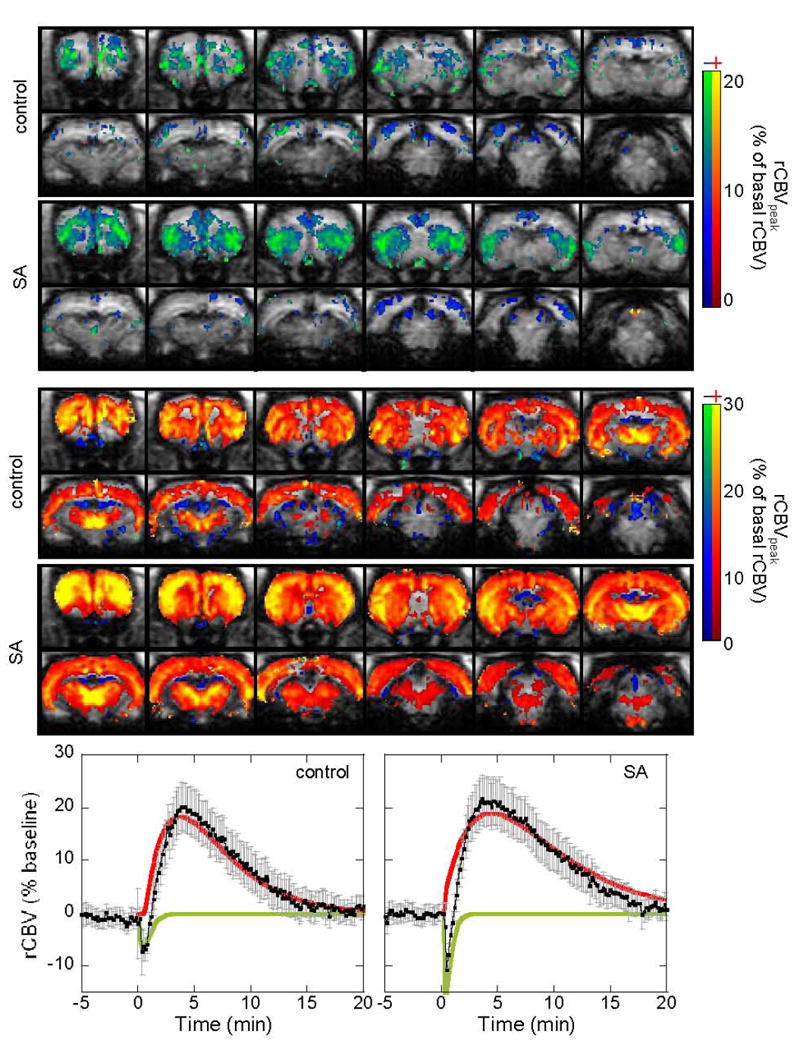
CBV responses to acute cocaine challenge (0.5mg/kg iv) for the cocaine-SA animals and saline-yoked animals with the fits to the negative (green line) and positive CBV components (red line). The upper panel shows brain areas with transient CBV decreases (fit to the green line), the 2nd panel shows brain areas with CBV increases (fit to the red line). Time courses are from the whole CPu.
Table 1.
Brain Regional Changes in rCBV in Cocaine and Saline Animals After Cocaine Challenge.
| Region of Interest | Peak rCBV | FWHM | ||
|---|---|---|---|---|
| Cocaine SA (n=7) | Saline (n=5) | Cocaine SA (N=7) | Saline (n=5) | |
| CPu | 21.1 ± 1.9* | 16.7 ± 3.0 | 8.4 ± 0.7* | 5.9 ± 1.1 |
| mPFC | 21.5 ± 3.5 | 22.0 ± 5.0 | 11.3 ± 1.6* | 7.3 ± 1.3 |
| Cing | 18.5 ± 3.0 | 21.1 ± 4.4 | 9.5 ± 1.6 | 7.8 ± 1.8 |
| Thal | 29.6 ± 4.3 | 30.0 ± 3.6 | 7.4 ± 0.6 | 7.1 ± 0.9 |
| S2 | 26.6 ± 2.5 | 24.1 ± 2.5 | 7.7 ± 0.6 | 6.2 ±1.0 |
| S1 | 19.8 ± 3.1 | 17.7 ± 2.4 | 6.3 ± 0.9 | 6.4 ± 0.9 |
| M1 | 27.7 ± 2.8* | 16.6 ± 2.7 | 6.6 ± 0.6 | 6.0 ±0.9 |
| NAc | 13.1 ± 1.7 | 16.2 ± 3.8 | 9.4 ± 1.7 | 7.5 ±1.7 |
| Hip | 13.4 ± 2.3 | 15.1 ± 2.2 | 8.6 ± 1.7 | 6.7 ± 0.3 |
| PPT | 12.7 ± 2.1 (n=6)* | 8.3 ± 1.5 (n=4) | 6.4 ± 0.4 | 6.3 ± 0.7 |
| VTA | 13.1 ± 1.8 | 12.2 ± 1.0 | 6.9 ± 0.5 | 5.5 ± 0.8 |
| HThal | -4.8 ± 0.8* | -9.0 ± 1.5 | ND | ND |
p<0.05 for cocaine SA animals compared to saline-yoked controls. Cocaine was administered at 0.5mg/kg i.v.
ND: not determined; CPu: Caudate putamen; mPFC: medical prefrontal cortex; S1: primary sensory cortex; S2: secondary sensory cortex; M1: primary motor cortex; NAc: nucleus accumbens; PPTg: pedunculopontine tegmental nucleus; VTA: ventral tegmental area
Figure 2.
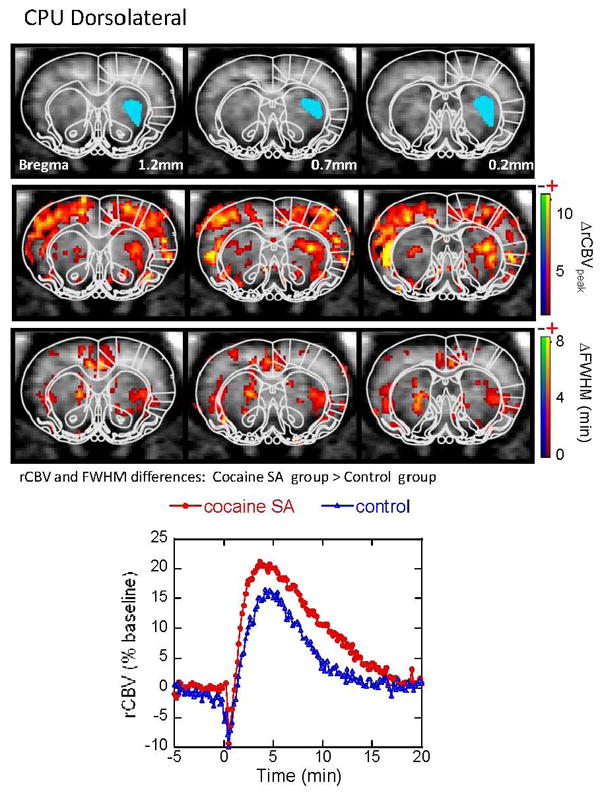
CBV response to acute cocaine challenge in the dorsolateral CPU. Maps are shown for regions showing significant differences between the cocaine-SA animals and controls in both CBV amplitude and FWHM. Cocaine-SA animals have a greater CBV increass and longer half-life (ie, longer FWHM), compared to the saline-yoked animals. Time courses are taken from ROI (the blue filled areas) in the top panel bilaterally (only one side is shown in blue for clarity).
Figure 5.
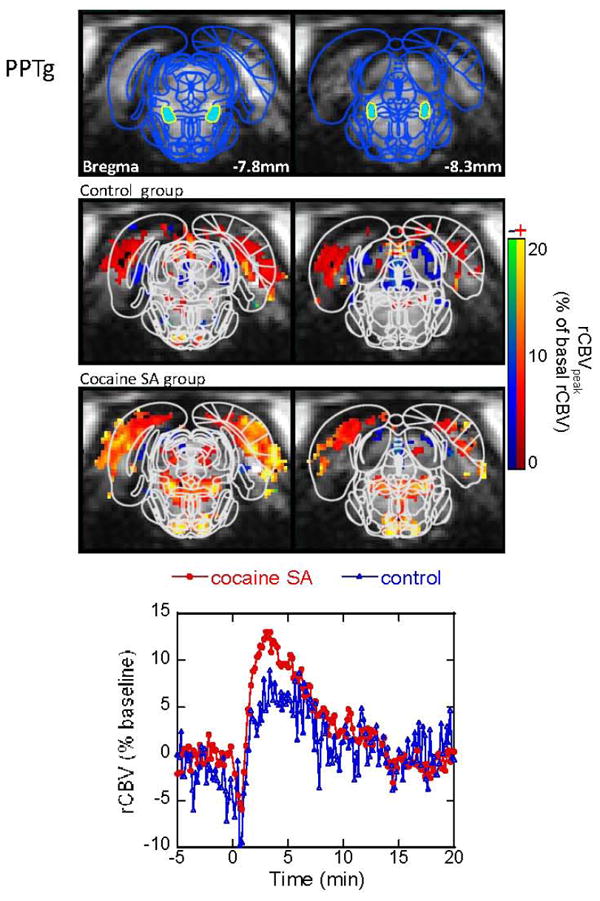
CBV response to acute cocaine challenge in the PPTg. Maps are shown for significant changes in CBV in both the cocaine-SA animals and saline-yoked controls. Cocaine-SA animals have greater CBV increases, compared to the saline-yoked animals. Time courses are taken from ROI (the blue filled areas) in the top panel.
Figure 3.
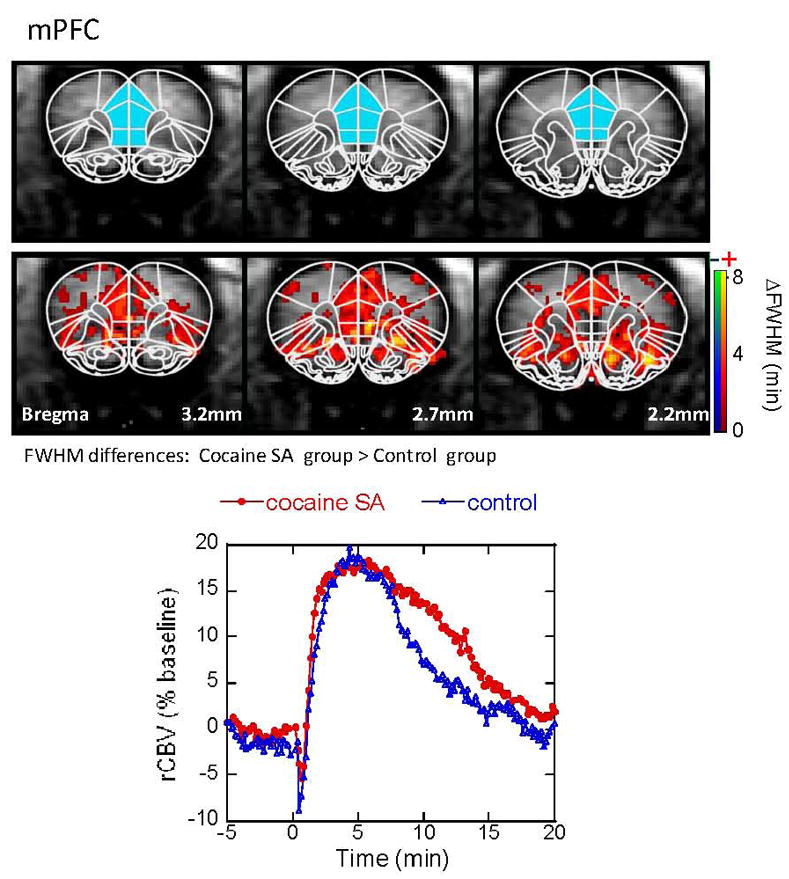
CBV response to acute cocaine challenge in the medial prefrontal cortex (mPFC). Maps are shown for regions showing significant differences between the cocaine-SA animals and controls in FWHM (the changes in CBV amplitude were not significant). Cocaine-SA animals have a larger integrated CBV response due to increased FWHM compared to the saline-yoked animals. Time courses are taken from ROI (the blue filled areas) in the top panel.
Figure 4.
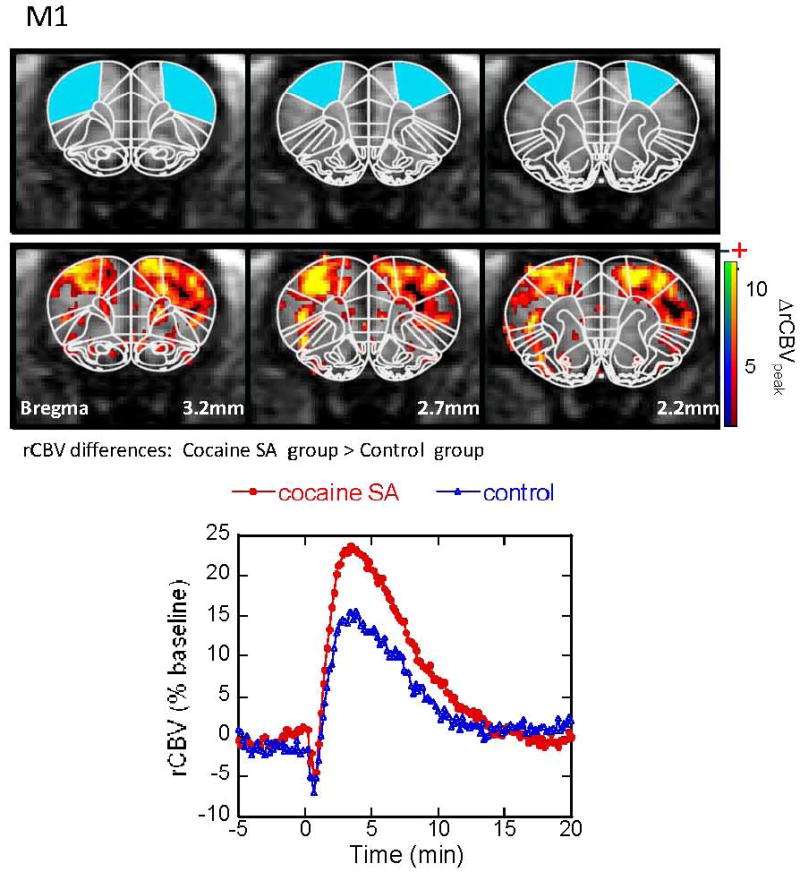
CBV response to acute cocaine challenge in M1 motor cortex. Maps are shown for regions showing significant differences between the cocaine-SA animals and controls in CBV amplitude. Cocaine-SA animals showed greater CBV increases, compared to the saline-yoked animals (but no change in FWHM). Time courses are taken from ROI (the blue filled areas) in the top panel.
Figure 6.
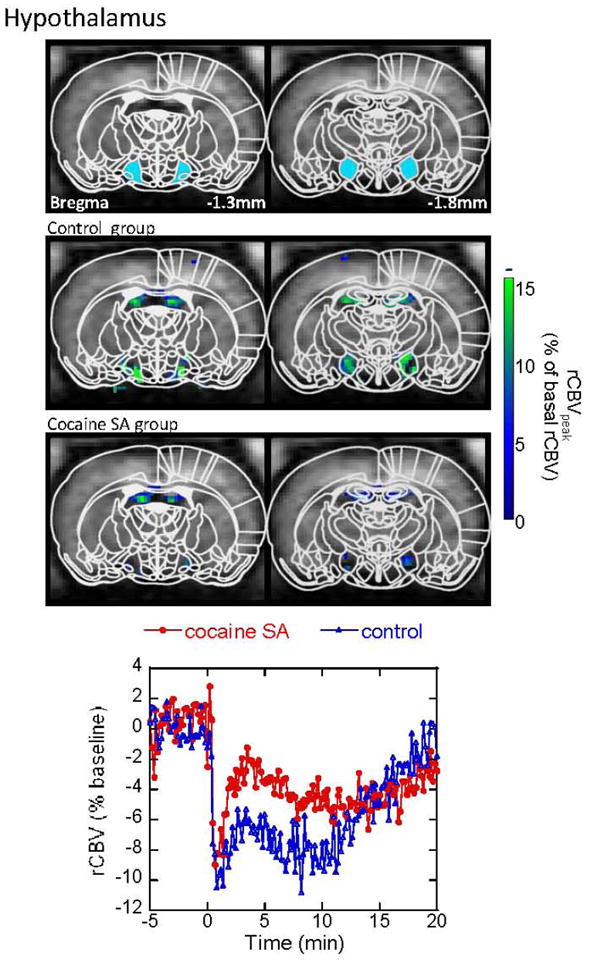
CBV response to acute cocaine challenge in the hypothalamus. Maps are shown for significant changes in CBV in both the cocaine-SA animals and saline-yoked controls. Note that in this brain regions the changes in CBV induced by cocaine challenge are negative compared to the positive CBV changes observed in the brain regions shown in the prior figures. Cocaine-SA animals have smaller CBV decreases, compared to the saline-yoked animals. Time courses are taken from ROI (the blue filled areas) in the top panel.
Functional Connectivity in Cocaine SA Animals
In order to assess the brain-wide effects of cocaine self-administration that may not be picked up by simple comparisons of alterations in CBV amplitude we compared the changes in “functional connectivity” (Biswal et al., 1995; Li et al., 2000; Pawela et al., 2008) in three groups of animals: naïve, saline-yoked and cocaine-SA following cocaine challenge. These data analyses were performed using different seed regions and the response during the 16 min during which CBV is elevated following cocaine injection after correction for the effects of the baseline (see Methods for full description of the analysis). These data revealed that at 28 days of abstinence the cocaine group demonstrated increased functional connectivity from almost all seed regions to other brain regions. The effects were particularly strong in numerous cortical areas – especially in S1 as well as mPFC, whether seeded from cortex or from thalamus. Interestingly, functional connectivity to and from the thalamus or mPFC was stronger in the saline-yoked controls than it was in the naïve animals (although weaker than the cocaine SA animals) indicating the effects of the overall protocol on these brain regions. Shown in Fig. 7 are maps demonstrating these effects for representative seed regions in mPFC, thalamus and CPu. Quantitative results are shown in Fig 10.
Figure 7.
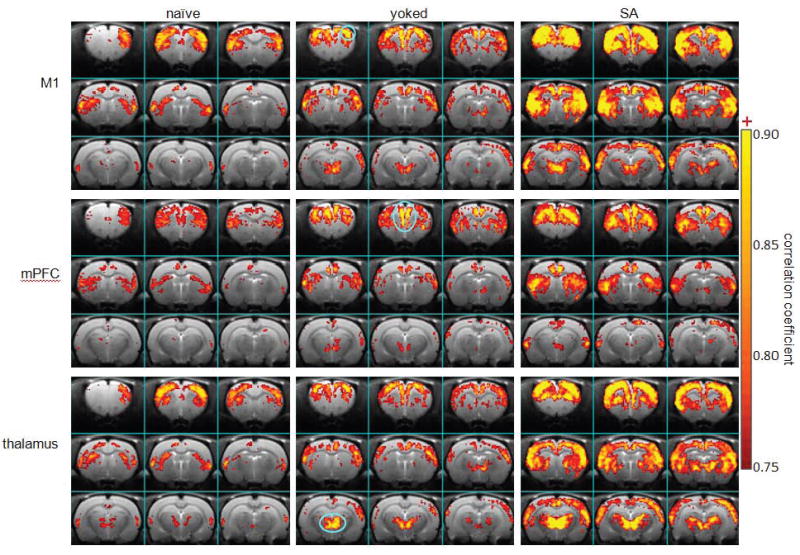
Maps of functional connectivity from S1, mPFC, and thalamus in responding to acute cocaine challenge (naïve, n=5; yoked control: n=5; cocaine SA: n=7). Functional connectivity from these three seeding areas were slightly increased in the yoked rats and significantly increased in the cocaine SA rats, compared to the naïve rats. Blue lines encircle the ROIs for the seeding areas.
Figure 10.
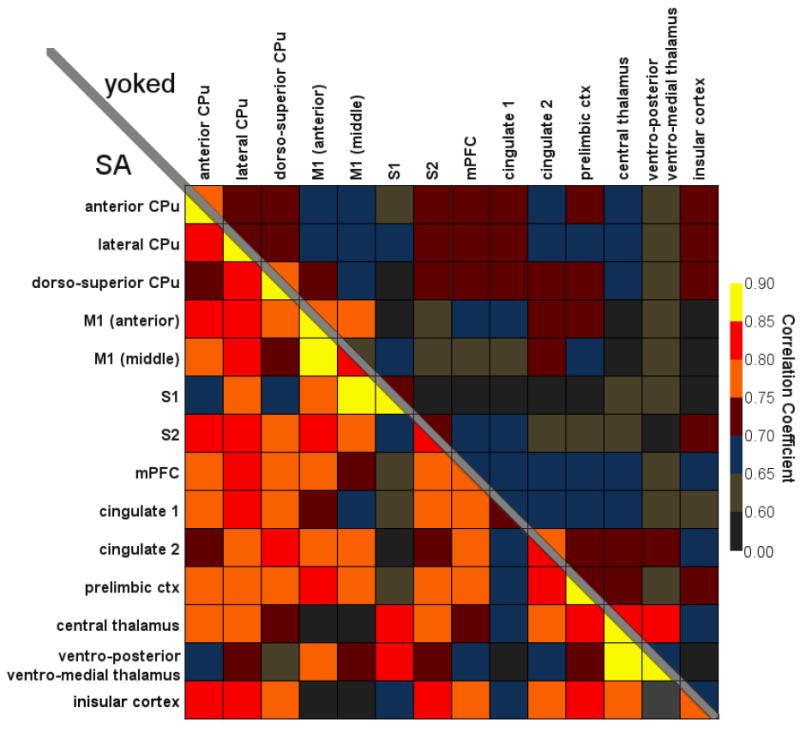
Cross correlation of functional connectivity upon acute cocaine challenge. Values represent correlation coefficients derived from connectivity analysis made as described in the Methods.
CBV response to 7-OHDPAT challenge
We were also interested in probing D3 receptor function as there are suggestions of increased D3 receptor binding in rats abstinent from cocaine for time periods comparable to those of the rats we studied here (Neisewander et al., 2004). Therefore, at the end of the cocaine imaging session (sixty min following cocaine injection), we injected a D3 preferring agonist 7-OHDPAT at 0.2mg/kg (i.v.). This drug induces a negative CBV that is larger in the NAc than in the CPu as one would expect from its D3 selectivity (Stanwood et al., 2000; Neisewander et al., 2004). The overall magnitude of the negative CBV change is larger in the control group than in the SA group comparing either the CBV time course or a map of the integrated CBV change between 10-60 min (Fig. 8). The integral of the CBV change in the NAc (where the D3 receptor density, along with the islets of Calleja is highest in the brain (Bouthenet et al., 1991; Sokoloff et al., 1992) was -16.4±5.3 in the control group (n=3) and -10.5±3.2 (n=4) in the SA group. There also appears to be a difference between the two groups in the mPFC with the integrated CBV changes being -14.7 ± 6.7 in the controls and -8.7±4.7 in the SA animals. Interestingly, 7-OHDPAT typically leads to a late CBV increase in the globus pallidus in naïve animals ((Choi et al., 2006) Fig. 3). As discussed later, this late CBV increase in the internal globus pallidus (GPi) may reflect the result of agonism of D2 receptors in the CPu. The late positive CBV response in the GPi was larger in the cocaine-SA rats than in the saline-yoked controls (Fig. 9).
Figure 8.
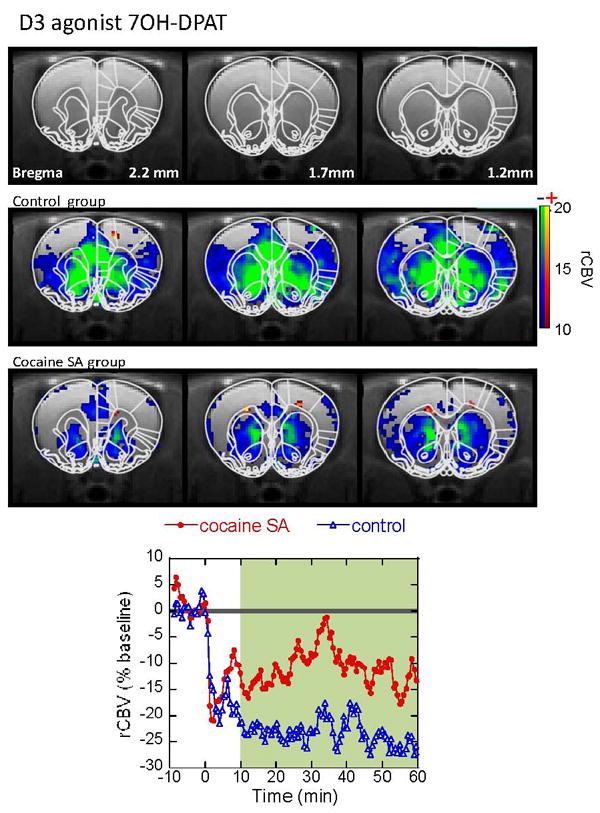
CBV response to acute challenge with the D3 agonist 7OH-DPAT. Maps are shown for significant changes in CBV in both the cocaine-SA animals and saline-yoked controls. There are significant CBV decreases in the mPFC, medial CPu, and NAc, where D3 receptor density is highest. The degree of CBV decreases to 7OH-DPAT challenge is less prominent in the cocaine-SA animals, compared to the saline yoked ones.
Figure 9.
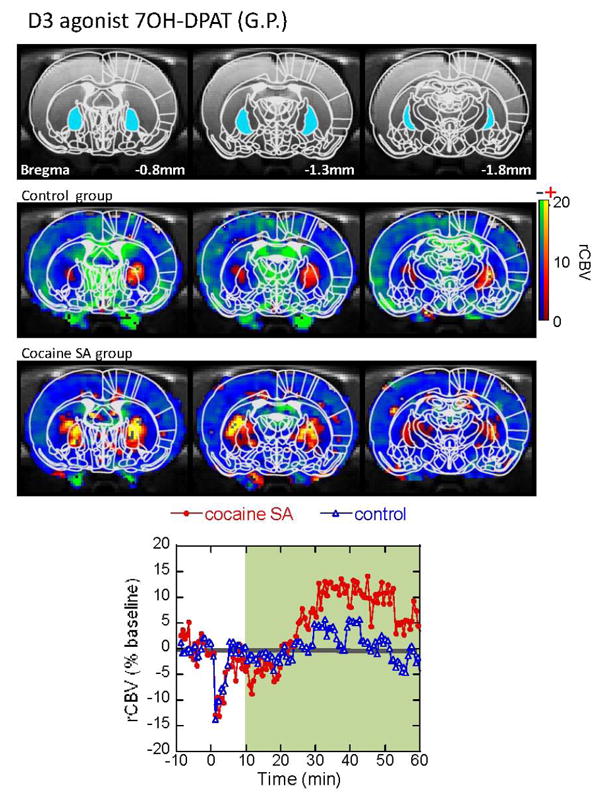
CBV reseponse to acute challenge with the D3 agonist 7OH-DPAT in the globus pallidus. There is a delayed CBV increase in the globus pallidus in saline-yoked animals, indicating downstream activity of the dopaminergic striato-pallidal neurons. The delayed positive CBV response was greater in the cocaine-SA rats, compared to the saline-yoked rats.
Discussion
These results indicate a pattern of alterations in limbic and motor circuitry in animals trained to self-administer cocaine. Our data show alterations in brain regions not previously described, such as hypothalamus or little described such as the PPTg. We also found alterations in functional connectivity in cocaine SA rats 28 days abstinent that is dramatically different from both the saline-yoked control group and naïve animals. Our data also show altered time courses for the CBV changes elicited by cocaine in various brain regions that have not previously been described such as hypothalamus. We found that there is a pronounced increase in the response to cocaine, as measured using the amplitude of changes in CBV, in primary motor cortex (M1) and in motor regions of the CPu. Smaller increases were noted in the PPTg. In addition to these increases in magnitude we also noted increases in the full width half-maximum (FWHM) of the CBV time course in the mPFC (but no change in peak CBV) and again in motor CPu. These changes are accompanied by alterations in functional connectivity in the cocaine SA animals. The alterations show large increases in the functional connectivity overall, with the largest increases occurring to and from cortical areas. These increases are not inconsistent with sensorimotor sensitization noted with cocaine self-administration. Given the ability of cocaine to greatly increase locomotor activity in rodents as well as to produce locomotor sensitization after chronic exposure (Marin et al., 2009), it is not surprising that we would see sensitization of sensorimotor cortex and the motor CPu. Given that we only examined rats with saline-yoked controls rather than cocaine-yoked controls (i.e. animals receiving cocaine non-contingently) it is possible that some of the changes we observed in the motor circuitry could be related to the motor conditioning of pushing the bar for the cocaine. We chose not to use a cocaine-yoked control as a substantial body of literature shows that non-contingent cocaine administration is highly stressful (Mutschler & Miczek, 1998; Galici et al., 2000; Lecca et al., 2007). Locomotor sensitization does occur, however, with non-contingent administration of cocaine (Marin et al., 2009).
There is a large body of evidence indicating dysregulation of the prefrontal cortex and its glutamatergic connections to the NAc as a consequence of substance abuse (Thomas et al., 2008; Koob, 2009). The frontal cortical-striatal circuitry is responsible for behavioral adaptations that may facilitate craving and the inability to inhibit drug taking (Kalivas, 2009; Koob & Volkow, 2010). A recent review by Koob and Volkow postulates that various elements of the reward/addiction circuitry are modulated at different time points in the addictive process (Koob & Volkow, 2010). These elements include the ventral tegmental area (VTA) and the ventral striatum in the initial intoxication phase, the extended amygdala for the withdrawal negative affect stage and a widely distributed network including orbitofrontal cortex, prefrontal cortex, striatum and hippocampus (among others) in the craving/preoccupation phase (Koob & Volkow, 2010). Since our rats were scanned 28 days after cessation of cocaine self-administration, they would presumably fall under the latter stage where much more widespread alterations in frontal, striatal, and hippocampal circuitry are postulated by Koob and Volkow (Koob & Volkow, 2010). It is unclear, however, what form such alterations might take in vivo. Our data show alterations in mPFC (increased FWHM), hippocampus (increased FWHM), and striatum (increased peak CBV and FWHM) and in numerous other brain regions using functional connectivity analysis as noted in Fig 10.
Our data show an increased FWHM in the mPFC in response to cocaine in the SA animals compared to controls. There are two possible explanations for this. The first is that a decrease in basal metabolism/hemodynamics might produce a larger response (Lee et al., 2003) as has been observed in fMRI in cases where basal CBF is lowered using something like hypocapnia (Cohen et al., 2002). Another possible explanation is that since there is little DAT in the mPFC leading to “volume transmission” of DA (Hitri et al., 1994; Haaparanta et al., 1996; Hall et al., 1999), there could be reduced clearance of DA in the SA animals. This mechanism was tested in both wild-type mice and mice with knockouts of catechol-O-methyltransferase (COMT) where it was found that cocaine induced an increased overflow time for DA without increasing the peak DA amplitude (Yavich et al., 2007), corresponding to what we found using phMRI (i.e. increased FWHM but not in peak amplitude). We previously showed that extracellular DA and CBV changes correlate linearly (at moderately high doses) following challenges with either DA releasers (such as amphetamine) or DAT blockers such as cocaine and (–)-2-β-Carbomethoxy-3-β-(4-fluorophenyl)tropane (β-CFT) (Chen et al., 1997; Chen et al., 2005; Choi et al., 2006; Ren et al., 2009). These prior studies show that the induced CBV changes following cocaine or amphetamine challenge can be used as a readout for changes in DA concentration. It is also possible that there are alterations in COMT activity in frontal cortex as a consequence of cocaine SA. Genetic polymorphisms of COMT that lead to higher or lower activity (and thereby lead to increased or decreased DA metabolism) produce correspondingly increased or decreased fMRI response in reward tasks in frontal cortex (Dreher et al., 2009).
Human studies show decreased functional connectivity in cocaine abusers compared to controls in either the resting state or in selective tasks using fMRI or following cocaine administration (Li et al., 2000; Gu et al., 2010; Hanlon et al., 2010). Our data show increased functional connectivity in rats. There a several possible interpretations of these differences. First, in humans, there are disparities in total cocaine administered and time of administration compared to our well controlled group. Second, the humans are awake in the scanner and this may lead to profound differences in the connectivities. However, the biggest difference is that in humans and in non-human primates cocaine produces BOLD or CBV decreases whereas in rats it leads to increases in BOLD or CBV (Breiter et al., 1997; Gollub et al., 1998; Kufahl et al., 2005; Mandeville et al., 2011).
The mPFC sends excitatory glutamatergic projections to the PPTg (Sesack et al., 1989) that in turn sends cholinergic and glutamatergic projections that synapse on DA neurons in the VTA. We recently showed that infusion of the AMPA antagonist CNQX directly into the PPTg attenuated the ability of a priming injection of cocaine to reinstate drug seeking in animals trained with the same self-administration protocol as those used in this study (Schmidt et al., 2009). This would accord with increased glutamatergic tone in the PPT that is reflected in increased CBV in response to cocaine and with the increased response we see in mPFC.
Interestingly, in the first minute after cocaine infusion there is a transient decrease in CBV that has recently been reported by Luo et al. (Luo et al., 2009) and us (Chen et al., 2010). Our maps of this early dip show that it is quite close to maps one sees with D2 agonists (Chen et al., 2005; Choi et al., 2006; Chen et al., 2010). We previously showed that D1/D5 agonism using numerous different D1 agonists produces positive CBV changes and D2/D3 agonism produces negative CBV changes and (Choi et al., 2006; Chen et al., 2010; Chen et al., 2010) thus this early dip is consistent with agonism of D2 receptors. Since D2 presynaptic receptors as well as D3 receptors have a much higher affinity for DA than do post-synaptic D2 or D1 receptors (Cooper et al., 2003), it is possible these receptors produce an earlier negative response than post-synaptic D1 and D2 receptors.
A previous study found a large decrease in the amplitude of the BOLD response to a cocaine challenge in rats that had been given repeated i.p. injections of cocaine compared to vehicle. Those data were collected in awake rats without control of CO2. Since CO2 can dramatically alter the BOLD, CBV or CBF response it is difficult to compare these data. Administration of cocaine can lead to hyperventilation (Sharkey et al., 1991) and reduced CBV (see Fig 12.4 in (Chen & Jenkins, 2007)). Since hyperventilation leads to decreased CO2 it would also lead to decreased BOLD in the cocaine animals (Febo et al., 2005). Our data show, however, that there are not huge differences in the amplitude of the response to cocaine in self-administering and saline-yoked controls, but rather more subtle regional differences in peak response and FWHM.
D2 and D3 Receptor Modulation
The effects of cocaine on dopamine receptors have been previously examined using in vivo positron emission tomography scans in rodents and primates including monkeys and humans. These studies show a consistent pattern of decreased D2 binding potential in both animals self-administering cocaine (Volkow et al., 1999; Nader & Czoty, 2005; Nader et al., 2006), as well as in human cocaine abusers (Martinez et al., 2004; Martinez et al., 2009; Volkow et al., 2009). Not as much work has gone into studying the effects of chronic cocaine administration on D3 receptors. One study of cocaine SA found that 2-8 days after abstinence that there was no change in D3 binding as measured using autoradiography, but at 30 days of abstinence following cocaine there was an increase in D3 receptor binding (Neisewander et al., 2004). Oddly in that paper they used a challenge dose of cocaine 24 hrs before the D3 autoradiography. Dopamine D3 receptor levels were also found to be increased in humans who had died of a cocaine overdose (Staley & Mash, 1996). Other data showed that a single dose of cocaine was enough to increase D3 receptor expression (Le Foll et al., 2005). Our data show a decreased response to the D3 preferring agonist 7-OHDPAT in the nucleus accumbens where there is very high D3 expression. We recently demonstrated the in vivo selectivity of 7-OHDPAT at 0.2 mg/kg by showing that the CBV response in NAc is much greater than that in the CPu as opposed to the D2 agonist norpropylapomorphine where the response in NAc and CPu is about equal (Choi et al., 2010). It should be noted that the phMRI data is producing a readout on the functional status of the receptors as opposed to autoradiography which looks at a static picture of receptors available for binding. Our data could be explained in two ways. First, Sokoloff’s group showed a single cocaine challenge can increase D3 expression at time points greater than about 4 hours after cocaine; at time points less than four hours following cocaine there was a significant decrease in D3R (Le Foll et al., 2005). Since we challenged the animals with cocaine 60 min before the D3 agonist it is possible that the decrease in D3R is larger in the cocaine SA animals than in controls. The other possibility is that there is diminished D3 tone overall in the cocaine SA animals, although this explanation would not agree with the D3 findings in either (Neisewander et al., 2004) or (Staley & Mash, 1996). Future molecular studies examining the functional status of these receptors should serve to distinguish between these two possibilities.
We previously showed that D2/D3 agonists produce negative CBV changes whereas D1/D5 agonists produce positive CBV changes (Chen et al., 2005; Choi et al., 2006; Chen et al., 2010). Although the primary response to cocaine in both the cocaine SA animal as well as the saline-yoked controls is mostly positive – there are brain regions in which a negative CBV response is found such as the septum or hypothalamus. The response of the hypothalamus to cocaine challenge produced a negative CBV change in both the cocaine SA animals as well as the saline-yoked controls. The time course for this change was quite distinct from that produced in the areas of the brain where mostly positive CBV changes were noted (compare Figs. 1-5 with Fig. 6). Indeed, the time course for the CBV change induced with cocaine in the hypothalamus matches well with the time course produced by administration of the D3 agonist 7-OHDPAT (compare time courses in Fig. 6 with Fig. 9) and both responses are larger in the saline-yoked animals than in the cocaine SA animals. We recently showed that 7-OHDPAT produces negative CBV changes in hypothalamus whereas the D3 selective antagonist PG-01037 produces positive changes in the hypothalamus (Choi et al., 2010). Therefore, these data suggest that measurement of cocaine-induced signal changes in hypothalamus may produce a readout on the status of D3 receptors, although this concept requires further proof. In summary, cocaine produces enduring changes in brain circuitry consistent with both motor sensitization (increase response to cocaine challenge in M1 cortex and motor striatum) as well as limbic alterations (altered dynamics in medial prefrontal cortex and decreased response to D3R stimulation in the nucleus accumbens). These data suggest the great potential that in vivo neuroimaging may play in discovering alterations in dopaminergic circuitry in brains subject to chronic intake of psychostimulants.
Acknowledgments
This work is partially supported by NIH 5R01DA016187 and NIH 1R21AT004455.
Citations
- Azar MR, Acar N, Erwin VG, Barbato GF, Morse AC, Heist CL, Jones BC. Distribution and clearance of cocaine in brain is influenced by genetics. Pharmacol Biochem Behav. 1998;59:637–640. doi: 10.1016/s0091-3057(97)00471-1. [DOI] [PubMed] [Google Scholar]
- Biswal B, Yetkin FZ, Haughton VM, Hyde JS. Functional connectivity in the motor cortex of resting human brain using echo-planar MRI. Magn Reson Med. 1995;34:537–541. doi: 10.1002/mrm.1910340409. [DOI] [PubMed] [Google Scholar]
- Bouthenet ML, Souil E, Martres MP, Sokoloff P, Giros B, Schwartz JC. Localization of dopamine D3 receptor mRNA in the rat brain using in situ hybridization histochemistry: comparison with dopamine D2 receptor mRNA. Brain Res. 1991;564:203–219. doi: 10.1016/0006-8993(91)91456-b. [DOI] [PubMed] [Google Scholar]
- Breiter HC, Gollub RL, Weisskoff RM, Kennedy DN, Makris N, Berke JD, Goodman JM, Kantor HL, Gastfriend DR, Riorden JP, Mathew RT, Rosen BR, Hyman SE. Acute effects of cocaine on human brain activity and emotion. Neuron. 1997;19:591–611. doi: 10.1016/s0896-6273(00)80374-8. [DOI] [PubMed] [Google Scholar]
- Carmona GN, Schindler CW, Greig NH, Holloway HW, Jufer RA, Cone EJ, Gorelick DA. Intravenous butyrylcholinesterase administration and plasma and brain levels of cocaine and metabolites in rats. Eur J Pharmacol. 2005;517:186–190. doi: 10.1016/j.ejphar.2005.05.013. [DOI] [PubMed] [Google Scholar]
- Chen Q, Andersen AH, Zhang Z, Ovadia A, Gash DM, Avison MJ. Mapping drug-induced changes in cerebral R2* by Multiple Gradient Recalled Echo functional MRI. Magn Reson Imaging. 1996;14:469–476. doi: 10.1016/0730-725x(95)02100-8. [DOI] [PubMed] [Google Scholar]
- Chen YI, Choi JK, Andersen SL, Rosen BR, Jenkins BG. Mapping dopamine D2/D3 receptor function using pharmacological magnetic resonance imaging. Psychopharmacology (Berl) 2005;180:705–715. doi: 10.1007/s00213-004-2034-0. [DOI] [PubMed] [Google Scholar]
- Chen YI, Choi JK, Xu H, Ren J, Andersen SL, Jenkins BG. Pharmacologic neuroimaging of the ontogeny of dopamine receptor function. Dev Neurosci. 2010;32:125–138. doi: 10.1159/000286215. [DOI] [PMC free article] [PubMed] [Google Scholar]
- Chen YI, Choi JK, Xu H, Ren JQ, Andersen SL, Jenkins BG. Pharmacologic neuroimaging of the ontogeny of dopamine receptor function. Developmental Neuroscience. 2010 doi: 10.1159/000286215. in press. [DOI] [PMC free article] [PubMed] [Google Scholar]
- Chen YI, Galpern WR, Brownell AL, Matthews RT, Bogdanov M, Isacson O, Keltner JR, Beal MF, Rosen BR, Jenkins BG. Detection of dopaminergic neurotransmitter activity using pharmacologic MRI: correlation with PET, microdialysis, and behavioral data. Magn Reson Med. 1997;38:389–398. doi: 10.1002/mrm.1910380306. [DOI] [PubMed] [Google Scholar]
- Chen YI, Jenkins BG. Pharmacological MRI as a molecular imaging technique. In: Modo MM, Bulte JWM, editors. Molecular and cellular MR Imaging. CRC Press; Boca Raton, FL: 2007. pp. 219–243. [Google Scholar]
- Chen YI, Mandeville JB, Nguyen TV, Talele A, Cavagna F, Jenkins BG. Improved mapping of pharmacologically induced neuronal activation using the IRON technique with superparamagnetic blood pool agents. J Magn Reson Imaging. 2001;14:517–524. doi: 10.1002/jmri.1215. [DOI] [PubMed] [Google Scholar]
- Choi JK, Chen YI, Hamel E, Jenkins BG. Brain hemodynamic changes mediated by dopamine receptors: Role of the cerebral microvasculature in dopamine-mediated neurovascular coupling. Neuroimage. 2006;30:700–712. doi: 10.1016/j.neuroimage.2005.10.029. [DOI] [PubMed] [Google Scholar]
- Choi JK, Mandeville JB, Chen YI, Grundt P, Sarkar SK, Newman AH, Jenkins BG. Imaging Brain Regional and Cortical Laminar Effects of Selective D3 Agonists and Antagonists. Psychopharmacology. 2010 doi: 10.1007/s00213-010-1924-6. in press. [DOI] [PMC free article] [PubMed] [Google Scholar]
- Cohen ER, Ugurbil K, Kim SG. Effect of basal conditions on the magnitude and dynamics of the blood oxygenation level-dependent fMRI response. J Cereb Blood Flow Metab. 2002;22:1042–1053. doi: 10.1097/00004647-200209000-00002. [DOI] [PubMed] [Google Scholar]
- Cooper JR, Bloom FE, Roth RH. The biochemical basis of neuropharmacology. Oxford University Press; Oxford ; New York: 2003. [Google Scholar]
- Dreher JC, Kohn P, Kolachana B, Weinberger DR, Berman KF. Variation in dopamine genes influences responsivity of the human reward system. Proc Natl Acad Sci U S A. 2009;106:617–622. doi: 10.1073/pnas.0805517106. [DOI] [PMC free article] [PubMed] [Google Scholar]
- Du C, Tully M, Volkow ND, Schiffer WK, Yu M, Luo Z, Koretsky AP, Benveniste H. Differential effects of anesthetics on cocaine’s pharmacokinetic and pharmacodynamic effects in brain. Eur J Neurosci. 2009;30:1565–1575. doi: 10.1111/j.1460-9568.2009.06931.x. [DOI] [PMC free article] [PubMed] [Google Scholar]
- Febo M, Segarra AC, Nair G, Schmidt K, Duong TQ, Ferris CF. The neural consequences of repeated cocaine exposure revealed by functional MRI in awake rats. Neuropsychopharmacology. 2005;30:936–943. doi: 10.1038/sj.npp.1300653. [DOI] [PMC free article] [PubMed] [Google Scholar]
- Galici R, Pechnick RN, Poland RE, France CP. Comparison of noncontingent versus contingent cocaine administration on plasma corticosterone levels in rats. Eur J Pharmacol. 2000;387:59–62. doi: 10.1016/s0014-2999(99)00780-3. [DOI] [PubMed] [Google Scholar]
- Gollub RL, Breiter HC, Kantor H, Kennedy D, Gastfriend D, Mathew RT, Makris N, Guimaraes A, Riorden J, Campbell T, Foley M, Hyman SE, Rosen B, Weisskoff R. Cocaine decreases cortical cerebral blood flow but does not obscure regional activation in functional magnetic resonance imaging in human subjects. J Cereb Blood Flow Metab. 1998;18:724–734. doi: 10.1097/00004647-199807000-00003. [DOI] [PubMed] [Google Scholar]
- Gu H, Salmeron BJ, Ross TJ, Geng X, Zhan W, Stein EA, Yang Y. Mesocorticolimbic circuits are impaired in chronic cocaine users as demonstrated by resting-state functional connectivity. Neuroimage. 2010;53:593–601. doi: 10.1016/j.neuroimage.2010.06.066. [DOI] [PMC free article] [PubMed] [Google Scholar]
- Haaparanta M, Bergman J, Laakso A, Hietala J, Solin O. [18F]CFT ([18F]WIN 35,428), a radioligand to study the dopamine transporter with PET: biodistribution in rats. Synapse. 1996;23:321–327. doi: 10.1002/(SICI)1098-2396(199608)23:4<321::AID-SYN10>3.0.CO;2-#. [DOI] [PubMed] [Google Scholar]
- Hall H, Halldin C, Guilloteau D, Chalon S, Emond P, Besnard J, Farde L, Sedvall G. Visualization of the dopamine transporter in the human brain postmortem with the new selective ligand [125I]PE2I. Neuroimage. 1999;9:108–116. doi: 10.1006/nimg.1998.0366. [DOI] [PubMed] [Google Scholar]
- Hanlon CA, Wesley MJ, Stapleton JR, Laurienti PJ, Porrino LJ. The association between frontal-striatal connectivity and sensorimotor control in cocaine users. Drug Alcohol Depend. 2010 doi: 10.1016/j.drugalcdep.2010.11.008. [DOI] [PMC free article] [PubMed] [Google Scholar]
- Hitri A, Casanova MF, Kleinman JE, Wyatt RJ. Fewer dopamine transporter receptors in the prefrontal cortex of cocaine users. Am J Psychiatry. 1994;151:1074–1076. doi: 10.1176/ajp.151.7.1074. [DOI] [PubMed] [Google Scholar]
- Kalivas PW. The glutamate homeostasis hypothesis of addiction. Nat Rev Neurosci. 2009;10:561–572. doi: 10.1038/nrn2515. [DOI] [PubMed] [Google Scholar]
- Koob GF. Neurobiological substrates for the dark side of compulsivity in addiction. Neuropharmacology. 2009;56(Suppl 1):18–31. doi: 10.1016/j.neuropharm.2008.07.043. [DOI] [PMC free article] [PubMed] [Google Scholar]
- Koob GF, Volkow ND. Neurocircuitry of addiction. Neuropsychopharmacology. 2010;35:217–238. doi: 10.1038/npp.2009.110. [DOI] [PMC free article] [PubMed] [Google Scholar]
- Kufahl PR, Li Z, Risinger RC, Rainey CJ, Wu G, Bloom AS, Li SJ. Neural responses to acute cocaine administration in the human brain detected by fMRI. Neuroimage. 2005;28:904–914. doi: 10.1016/j.neuroimage.2005.06.039. [DOI] [PubMed] [Google Scholar]
- Le Foll B, Diaz J, Sokoloff P. A single cocaine exposure increases BDNF and D3 receptor expression: implications for drug-conditioning. Neuroreport. 2005;16:175–178. doi: 10.1097/00001756-200502080-00022. [DOI] [PubMed] [Google Scholar]
- Lecca D, Cacciapaglia F, Valentini V, Acquas E, Di Chiara G. Differential neurochemical and behavioral adaptation to cocaine after response contingent and noncontingent exposure in the rat. Psychopharmacology (Berl) 2007;191:653–667. doi: 10.1007/s00213-006-0496-y. [DOI] [PubMed] [Google Scholar]
- Lee JH, Telang FW, Springer CS, Jr, Volkow ND. Abnormal brain activation to visual stimulation in cocaine abusers. Life Sci. 2003;73:1953–1961. doi: 10.1016/s0024-3205(03)00548-4. [DOI] [PubMed] [Google Scholar]
- Levant B, Bancroft GN, Selkirk CM. In vivo occupancy of D2 dopamine receptors by 7-OH-DPAT. Synapse. 1996;24:60–64. doi: 10.1002/(SICI)1098-2396(199609)24:1<60::AID-SYN7>3.0.CO;2-E. [DOI] [PubMed] [Google Scholar]
- Li SJ, Biswal B, Li Z, Risinger R, Rainey C, Cho JK, Salmeron BJ, Stein EA. Cocaine administration decreases functional connectivity in human primary visual and motor cortex as detected by functional MRI. Magn Reson Med. 2000;43:45–51. doi: 10.1002/(sici)1522-2594(200001)43:1<45::aid-mrm6>3.0.co;2-0. [DOI] [PubMed] [Google Scholar]
- Luo F, Schmidt KF, Fox GB, Ferris CF. Differential responses in CBF and CBV to cocaine as measured by fMRI: implications for pharmacological MRI signals derived oxygen metabolism assessment. J Psychiatr Res. 2009;43:1018–1024. doi: 10.1016/j.jpsychires.2008.11.009. [DOI] [PubMed] [Google Scholar]
- Mandeville JB, Choi JK, Jarraya B, Rosen BR, Jenkins BG, Vanduffel W. fMRI of Cocaine Self-Administration in Macaques Reveals Functional Inhibition of Basal Ganglia. Neuropsychopharmacology. 2011 doi: 10.1038/npp.2011.1. [DOI] [PMC free article] [PubMed] [Google Scholar]
- Mandeville JB, Jenkins BG, Chen YI, Choi JK, Kim YR, Belen D, Liu C, Kosofsky BE, Marota JJ. Exogenous contrast agent improves sensitivity of gradient-echo functional magnetic resonance imaging at 9.4 T. Magn Reson Med. 2004;52:1272–1281. doi: 10.1002/mrm.20278. [DOI] [PubMed] [Google Scholar]
- Mandeville JB, Jenkins BG, Kosofsky BE, Moskowitz MA, Rosen BR, Marota JJ. Regional sensitivity and coupling of BOLD and CBV changes during stimulation of rat brain. Magn Reson Med. 2001;45:443–447. doi: 10.1002/1522-2594(200103)45:3<443::aid-mrm1058>3.0.co;2-3. [DOI] [PubMed] [Google Scholar]
- Marin MT, Berkow A, Golden SA, Koya E, Planeta CS, Hope BT. Context-specific modulation of cocaine-induced locomotor sensitization and ERK and CREB phosphorylation in the rat nucleus accumbens. Eur J Neurosci. 2009;30:1931–1940. doi: 10.1111/j.1460-9568.2009.06982.x. [DOI] [PMC free article] [PubMed] [Google Scholar]
- Marota JJ, Mandeville JB, Weisskoff RM, Moskowitz MA, Rosen BR, Kosofsky BE. Cocaine activation discriminates dopaminergic projections by temporal response: an fMRI study in Rat. Neuroimage. 2000;11:13–23. doi: 10.1006/nimg.1999.0520. [DOI] [PubMed] [Google Scholar]
- Martinez D, Broft A, Foltin RW, Slifstein M, Hwang DR, Huang Y, Perez A, Frankle WG, Cooper T, Kleber HD, Fischman MW, Laruelle M. Cocaine dependence and d2 receptor availability in the functional subdivisions of the striatum: relationship with cocaine-seeking behavior. Neuropsychopharmacology. 2004;29:1190–1202. doi: 10.1038/sj.npp.1300420. [DOI] [PubMed] [Google Scholar]
- Martinez D, Greene K, Broft A, Kumar D, Liu F, Narendran R, Slifstein M, Van Heertum R, Kleber HD. Lower level of endogenous dopamine in patients with cocaine dependence: findings from PET imaging of D(2)/D(3) receptors following acute dopamine depletion. Am J Psychiatry. 2009;166:1170–1177. doi: 10.1176/appi.ajp.2009.08121801. [DOI] [PMC free article] [PubMed] [Google Scholar]
- Morgan D, Grant KA, Gage HD, Mach RH, Kaplan JR, Prioleau O, Nader SH, Buchheimer N, Ehrenkaufer RL, Nader MA. Social dominance in monkeys: dopamine D2 receptors and cocaine self-administration. Nat Neurosci. 2002;5:169–174. doi: 10.1038/nn798. [DOI] [PubMed] [Google Scholar]
- Mutschler NH, Miczek KA. Withdrawal from a self-administered or non-contingent cocaine binge: differences in ultrasonic distress vocalizations in rats. Psychopharmacology (Berl) 1998;136:402–408. doi: 10.1007/s002130050584. [DOI] [PubMed] [Google Scholar]
- Nader MA, Czoty PW. PET imaging of dopamine D2 receptors in monkey models of cocaine abuse: genetic predisposition versus environmental modulation. Am J Psychiatry. 2005;162:1473–1482. doi: 10.1176/appi.ajp.162.8.1473. [DOI] [PubMed] [Google Scholar]
- Nader MA, Czoty PW, Gould RW, Riddick NV. Review. Positron emission tomography imaging studies of dopamine receptors in primate models of addiction. Philos Trans R Soc Lond B Biol Sci. 2008;363:3223–3232. doi: 10.1098/rstb.2008.0092. [DOI] [PMC free article] [PubMed] [Google Scholar]
- Nader MA, Morgan D, Gage HD, Nader SH, Calhoun TL, Buchheimer N, Ehrenkaufer R, Mach RH. PET imaging of dopamine D2 receptors during chronic cocaine self-administration in monkeys. Nat Neurosci. 2006;9:1050–1056. doi: 10.1038/nn1737. [DOI] [PubMed] [Google Scholar]
- Neisewander JL, Fuchs RA, Tran-Nguyen LT, Weber SM, Coffey GP, Joyce JN. Increases in dopamine D3 receptor binding in rats receiving a cocaine challenge at various time points after cocaine self-administration: implications for cocaine-seeking behavior. Neuropsychopharmacology. 2004;29:1479–1487. doi: 10.1038/sj.npp.1300456. [DOI] [PubMed] [Google Scholar]
- Othman AA, Newman AH, Eddington ND. Applicability of the dopamine and rate hypotheses in explaining the differences in behavioral pharmacology of the chloro-benztropine analogs: studies conducted using intracerebral microdialysis and population pharmacodynamic modeling. J Pharmacol Exp Ther. 2007;322:760–769. doi: 10.1124/jpet.107.123315. [DOI] [PubMed] [Google Scholar]
- Pawela CP, Biswal BB, Cho YR, Kao DS, Li R, Jones SR, Schulte ML, Matloub HS, Hudetz AG, Hyde JS. Resting-state functional connectivity of the rat brain. Magn Reson Med. 2008;59:1021–1029. doi: 10.1002/mrm.21524. [DOI] [PMC free article] [PubMed] [Google Scholar]
- Paxinos G, Watson C. The rat brain in stereotaxic coordinates. Academic Press; San Diego: 1997. [DOI] [PubMed] [Google Scholar]
- Perry JL, Larson EB, German JP, Madden GJ, Carroll ME. Impulsivity (delay discounting) as a predictor of acquisition of IV cocaine self-administration in female rats. Psychopharmacology (Berl) 2005;178:193–201. doi: 10.1007/s00213-004-1994-4. [DOI] [PubMed] [Google Scholar]
- Ren J, Xu H, Choi JK, Jenkins BG, Chen YI. Dopaminergic response to graded dopamine concentration elicited by four amphetamine doses. Synapse. 2009;63:764–772. doi: 10.1002/syn.20659. [DOI] [PMC free article] [PubMed] [Google Scholar]
- Schmidt HD, Anderson SM, Famous KR, Kumaresan V, Pierce RC. Anatomy and pharmacology of cocaine priming-induced reinstatement of drug seeking. Eur J Pharmacol. 2005;526:65–76. doi: 10.1016/j.ejphar.2005.09.068. [DOI] [PubMed] [Google Scholar]
- Schmidt HD, Famous KR, Pierce RC. The limbic circuitry underlying cocaine seeking encompasses the PPTg/LDT. Eur J Neurosci. 2009;30:1358–1369. doi: 10.1111/j.1460-9568.2009.06904.x. [DOI] [PMC free article] [PubMed] [Google Scholar]
- Schwarz AJ, Zocchi A, Reese T, Gozzi A, Garzotti M, Varnier G, Curcuruto O, Sartori I, Girlanda E, Biscaro B, Crestan V, Bertani S, Heidbreder C, Bifone A. Concurrent pharmacological MRI and in situ microdialysis of cocaine reveal a complex relationship between the central hemodynamic response and local dopamine concentration. Neuroimage. 2004;23:296–304. doi: 10.1016/j.neuroimage.2004.05.001. [DOI] [PubMed] [Google Scholar]
- Sesack SR, Deutch AY, Roth RH, Bunney BS. Topographical organization of the efferent projections of the medial prefrontal cortex in the rat: an anterograde tract-tracing study with Phaseolus vulgaris leucoagglutinin. J Comp Neurol. 1989;290:213–242. doi: 10.1002/cne.902900205. [DOI] [PubMed] [Google Scholar]
- Sharkey J, McBean DE, Kelly PA. Acute cocaine administration: effects on local cerebral blood flow and metabolic demand in the rat. Brain Res. 1991;548:310–314. doi: 10.1016/0006-8993(91)91138-q. [DOI] [PubMed] [Google Scholar]
- Sokoloff P, Martres MP, Giros B, Bouthenet ML, Schwartz JC. The third dopamine receptor (D3) as a novel target for antipsychotics. Biochem Pharmacol. 1992;43:659–666. doi: 10.1016/0006-2952(92)90227-a. [DOI] [PubMed] [Google Scholar]
- Staley JK, Mash DC. Adaptive increase in D3 dopamine receptors in the brain reward circuits of human cocaine fatalities. J Neurosci. 1996;16:6100–6106. doi: 10.1523/JNEUROSCI.16-19-06100.1996. [DOI] [PMC free article] [PubMed] [Google Scholar]
- Stanwood GD, Artymyshyn RP, Kung MP, Kung HF, Lucki I, McGonigle P. Quantitative autoradiographic mapping of rat brain dopamine D3 binding with [(125)I]7-OH-PIPAT: evidence for the presence of D3 receptors on dopaminergic and nondopaminergic cell bodies and terminals. J Pharmacol Exp Ther. 2000;295:1223–1231. [PubMed] [Google Scholar]
- Telang FW, Volkow ND, Levy A, Logan J, Fowler JS, Felder C, Wong C, Wang GJ. Distribution of tracer levels of cocaine in the human brain as assessed with averaged [11C]cocaine images. Synapse. 1999;31:290–296. doi: 10.1002/(SICI)1098-2396(19990315)31:4<290::AID-SYN7>3.0.CO;2-G. [DOI] [PubMed] [Google Scholar]
- Thomas MJ, Kalivas PW, Shaham Y. Neuroplasticity in the mesolimbic dopamine system and cocaine addiction. Br J Pharmacol. 2008;154:327–342. doi: 10.1038/bjp.2008.77. [DOI] [PMC free article] [PubMed] [Google Scholar]
- Volkow ND, Fowler JS, Gatley SJ, Dewey SL, Wang GJ, Logan J, Ding YS, Franceschi D, Gifford A, Morgan A, Pappas N, King P. Comparable changes in synaptic dopamine induced by methylphenidate and by cocaine in the baboon brain. Synapse. 1999;31:59–66. doi: 10.1002/(SICI)1098-2396(199901)31:1<59::AID-SYN8>3.0.CO;2-Y. [DOI] [PubMed] [Google Scholar]
- Volkow ND, Fowler JS, Wang GJ, Baler R, Telang F. Imaging dopamine’s role in drug abuse and addiction. Neuropharmacology. 2009;56(Suppl 1):3–8. doi: 10.1016/j.neuropharm.2008.05.022. [DOI] [PMC free article] [PubMed] [Google Scholar]
- Volkow ND, Fowler JS, Wang GJ, Swanson JM. Dopamine in drug abuse and addiction: results from imaging studies and treatment implications. Mol Psychiatry. 2004;9:557–569. doi: 10.1038/sj.mp.4001507. [DOI] [PubMed] [Google Scholar]
- Volkow ND, Wang GJ, Fowler JS, Franceschi D, Thanos PK, Wong C, Gatley SJ, Ding YS, Molina P, Schlyer D, Alexoff D, Hitzemann R, Pappas N. Cocaine abusers show a blunted response to alcohol intoxication in limbic brain regions. Life Sci. 2000;66:PL161–167. doi: 10.1016/s0024-3205(00)00421-5. [DOI] [PubMed] [Google Scholar]
- Yavich L, Forsberg MM, Karayiorgou M, Gogos JA, Mannisto PT. Site-specific role of catechol-O-methyltransferase in dopamine overflow within prefrontal cortex and dorsal striatum. J Neurosci. 2007;27:10196–10209. doi: 10.1523/JNEUROSCI.0665-07.2007. [DOI] [PMC free article] [PubMed] [Google Scholar]


