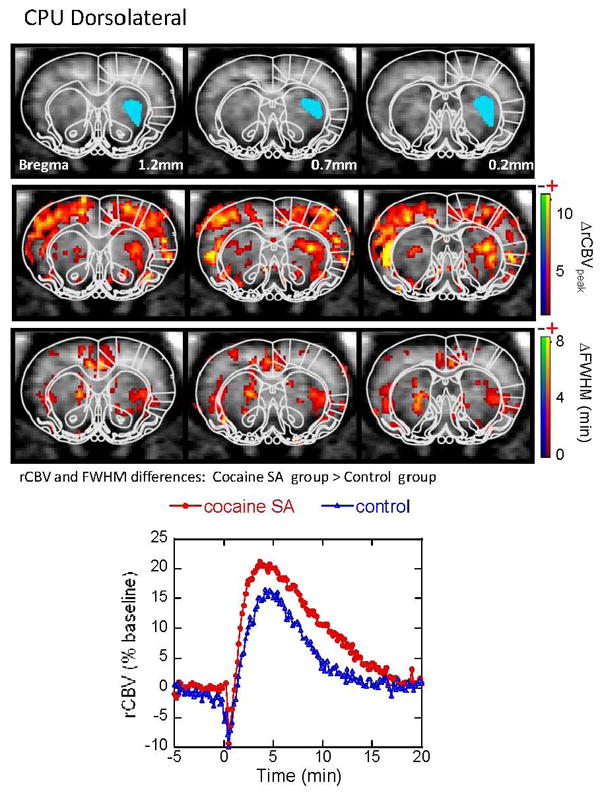
Figure 2.

CBV response to acute cocaine challenge in the dorsolateral CPU. Maps are shown for regions showing significant differences between the cocaine-SA animals and controls in both CBV amplitude and FWHM. Cocaine-SA animals have a greater CBV increass and longer half-life (ie, longer FWHM), compared to the saline-yoked animals. Time courses are taken from ROI (the blue filled areas) in the top panel bilaterally (only one side is shown in blue for clarity).
