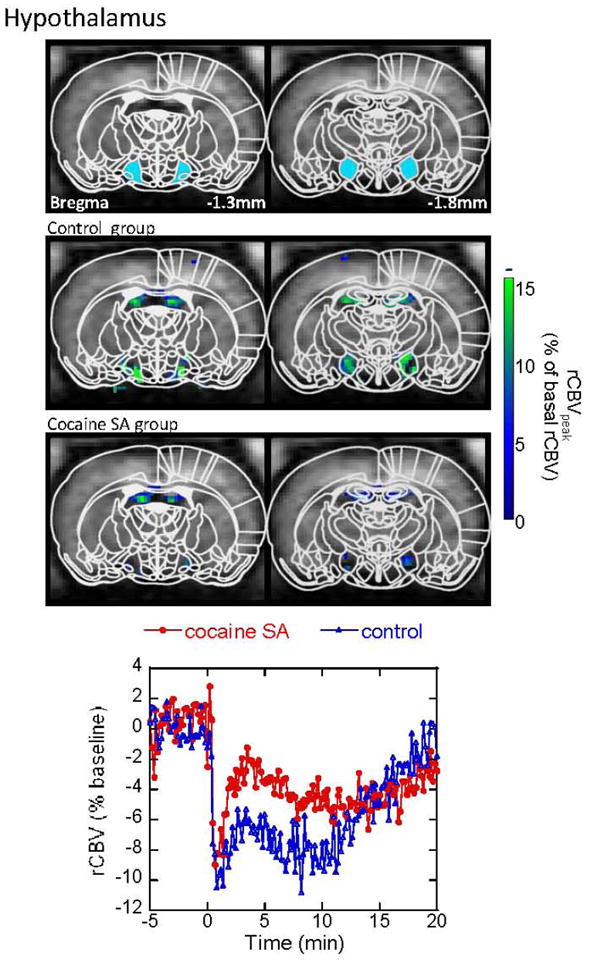
Figure 6.

CBV response to acute cocaine challenge in the hypothalamus. Maps are shown for significant changes in CBV in both the cocaine-SA animals and saline-yoked controls. Note that in this brain regions the changes in CBV induced by cocaine challenge are negative compared to the positive CBV changes observed in the brain regions shown in the prior figures. Cocaine-SA animals have smaller CBV decreases, compared to the saline-yoked animals. Time courses are taken from ROI (the blue filled areas) in the top panel.
