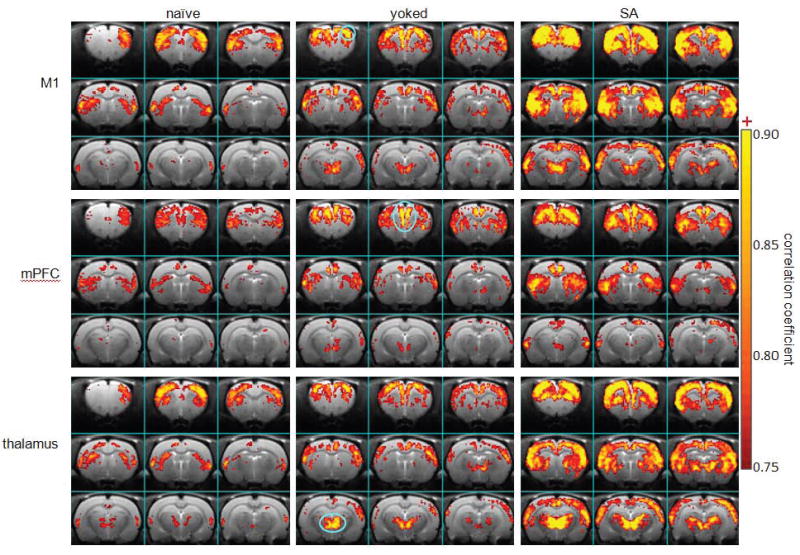
Figure 7.

Maps of functional connectivity from S1, mPFC, and thalamus in responding to acute cocaine challenge (naïve, n=5; yoked control: n=5; cocaine SA: n=7). Functional connectivity from these three seeding areas were slightly increased in the yoked rats and significantly increased in the cocaine SA rats, compared to the naïve rats. Blue lines encircle the ROIs for the seeding areas.
