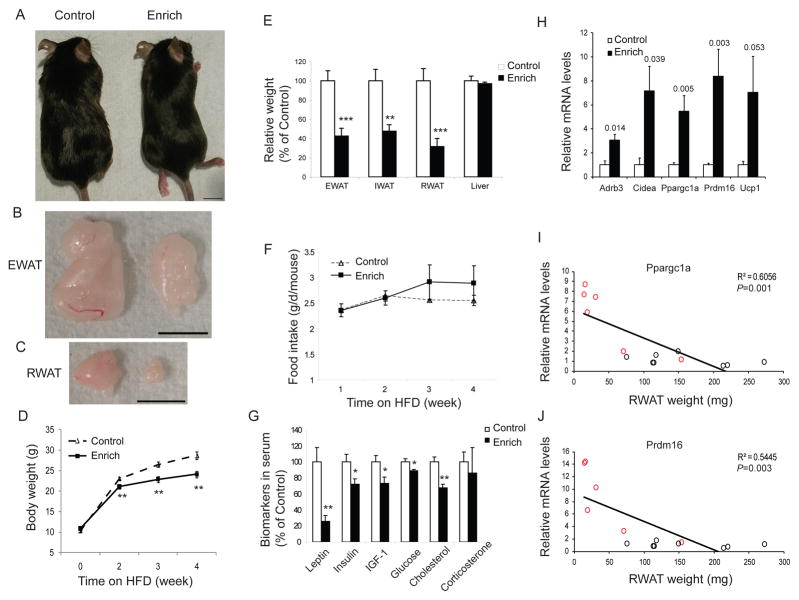
Figure 3.
EE prevents DIO. (A–C) EE mice remained lean compared to control mice when fed on HFD. Scale bar: 1 cm. EE mice had less weight gain (D) and fat mass (E) (n=10 per group). (F) Food intake. (G) Biomarkers in serum. (H) Gene expression profile in RWAT (n=5 per group). P values of significance were shown above the bars. (I–J) Ppargc1a and Prdm16 mRNA levels were inversely correlated to RWAT weight. Red circles: individual EE mouse, black circles: individual control mouse. * P<0.05, ** P<0.01, *** P<0.001. Data are means±SEM.

