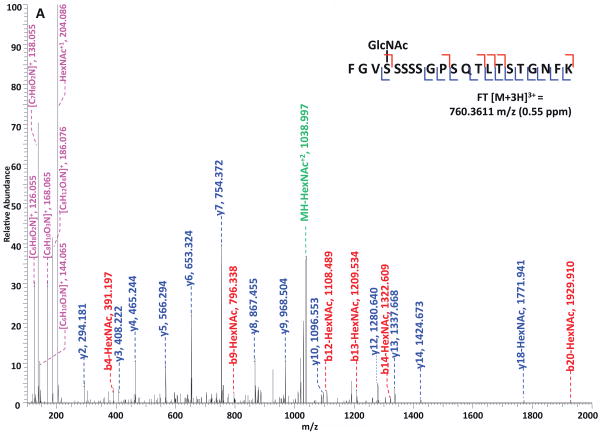
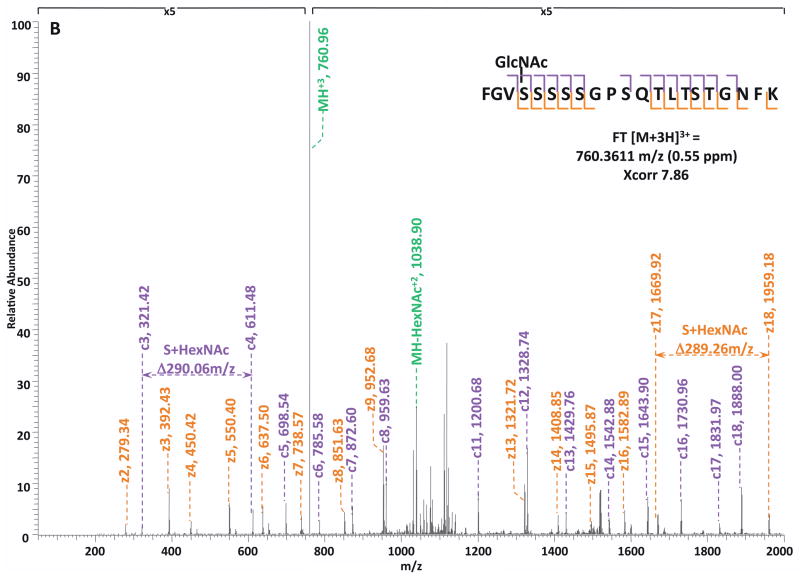
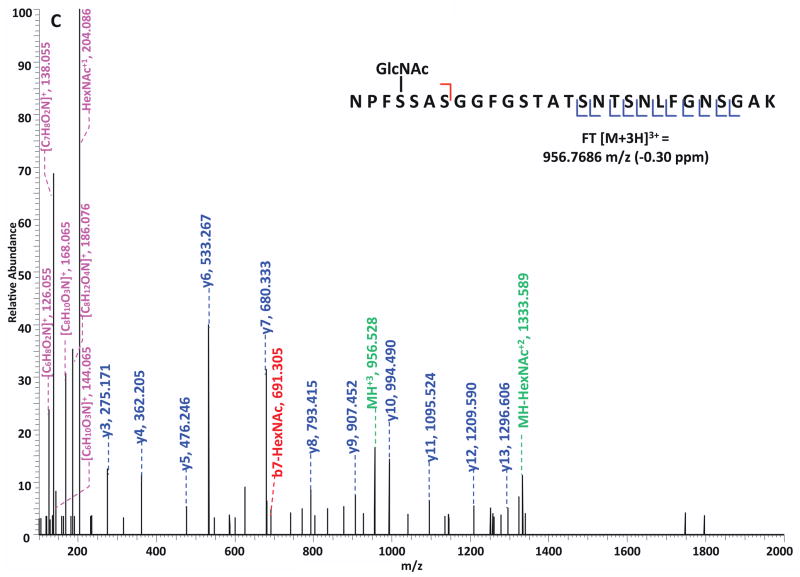
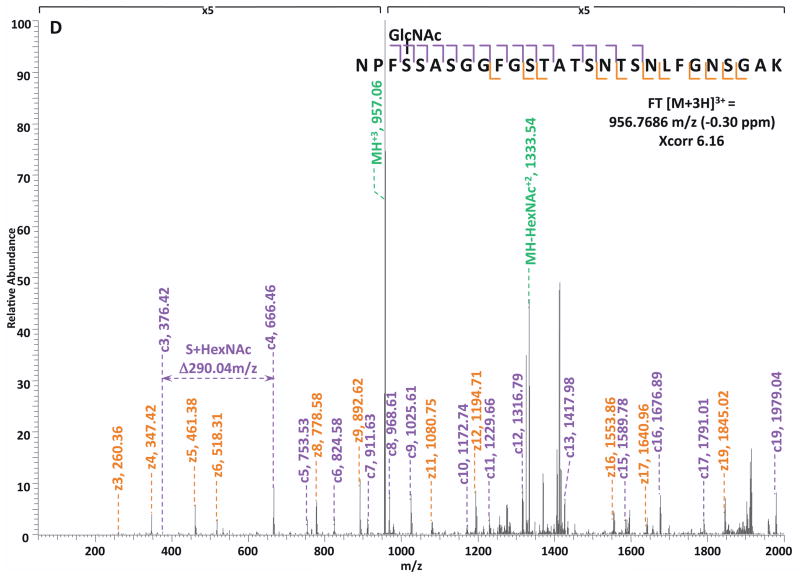
Figure 4. Corresponding HCD and ETD spectra of O-GlcNAc modified peptides identified in the enriched HEK293T sample.
(A–B) HCD and corresponding ETD spectra of peptide FGVS(GlcNAc)SSSSGPSQTLTSTGNFK; (C–D) HCD and corresponding ETD spectra of peptide NPFS(GlcNAc)SASGGFGSTATSNTSNLFGNSGAK. Note: “-HexNAc” or “-H2O” indicates the loss of HexNAc or H2O. The HCD spectra of both peptides exhibit the signature ion pattern of HexNAc fragments at the low m/z range, and both ETD spectra sufficient c- and z- ions with HexNAc modification for site assignment.


