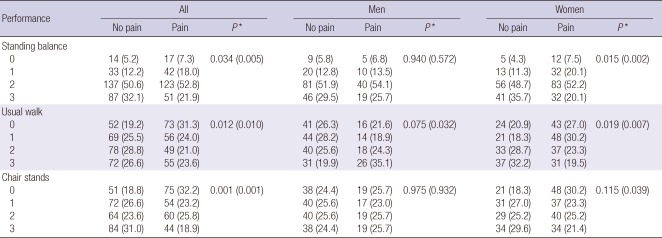
Table 5.
Comparison of the proportion of subjects belonging to each category of physical performance test according to the status of knee pain
For standing balance, the subjects were given a score of 0-3 as described in the method. For usual walk test and repeated chair stands test, we created quartiles based on the performance of the study subjects with 0 representing the worst and 3 representing the best performance. Values are the number (%). Distribution of categories according to knee pain status was compared with chi-square test. P* indicates P value (P value for trend).

