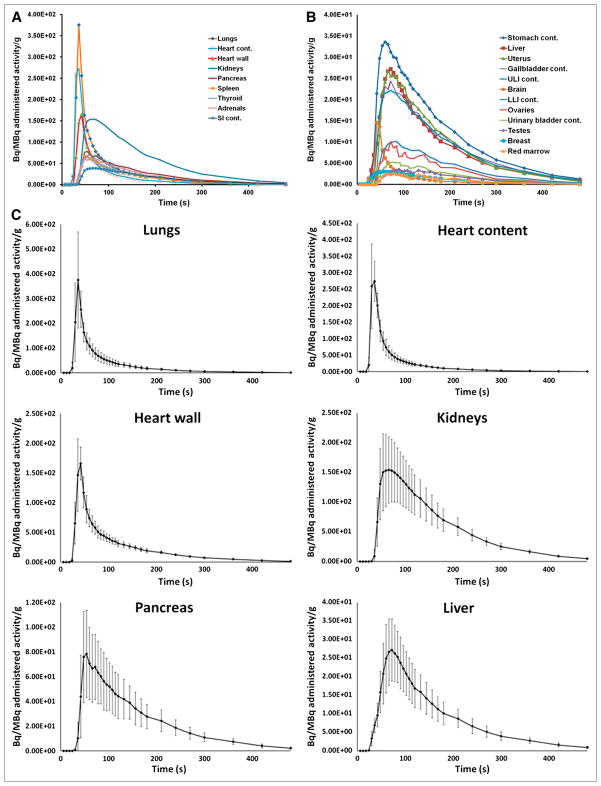
FIGURE 2.
82Rb organ time–activity curves plotted as activity concentration, normalized to administered activity for organs with high uptake (A) and organs with low uptake (B) (mean value of all subjects is shown at each time point) and selected source organs with high time-integrated activity coefficient (mean and SD are indicated at each time point) (C). cont. = contents.

