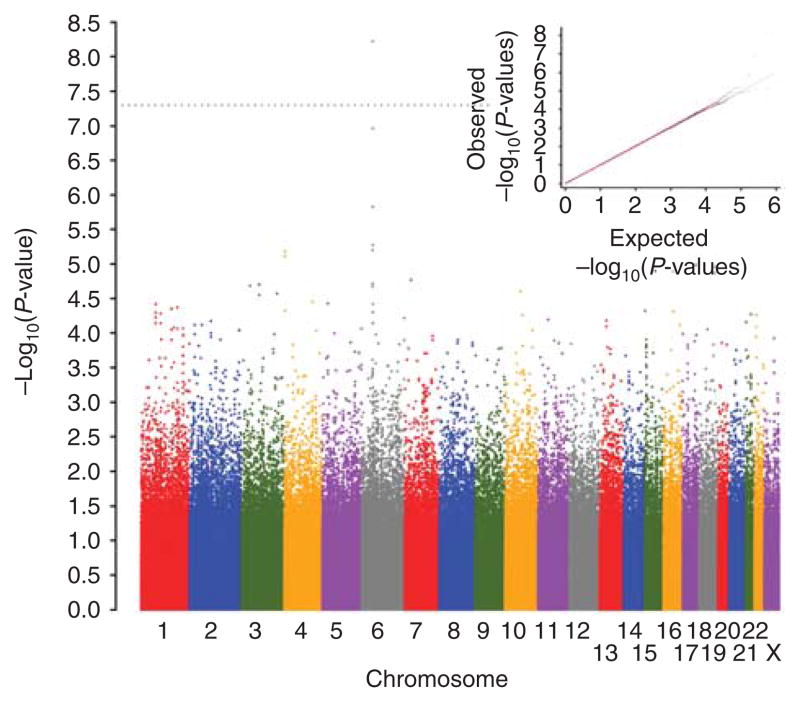
Figure 1. Genome-wide association results for generalized vitiligo age of onset.
The genome-wide distribution of −log10(P-values) from the unadjusted linear regression analysis for 520,460 polymorphic single-nucleotide polymorphisms (SNPs) that passed quality control (QC) filters in 1,339 unrelated generalized vitiligo patients is shown plotted across the chromosomes. The dotted line indicates the genome-wide significance criterion (P<5×10⁻⁸). The inset shows quantile–quantile (Q–Q) plots of the observed versus expected −log10(P-values) for unadjusted linear regression statistics. The plot in red shows P-values for all 520,460 SNPs, whereas the plot in blue shows P-values excluding the 3,400 SNPs located across the extended major histocompatibility complex (MHC; chromosome 6: 25.9–33.4 Mb, genome build GRCh37).

