Fig. 5.

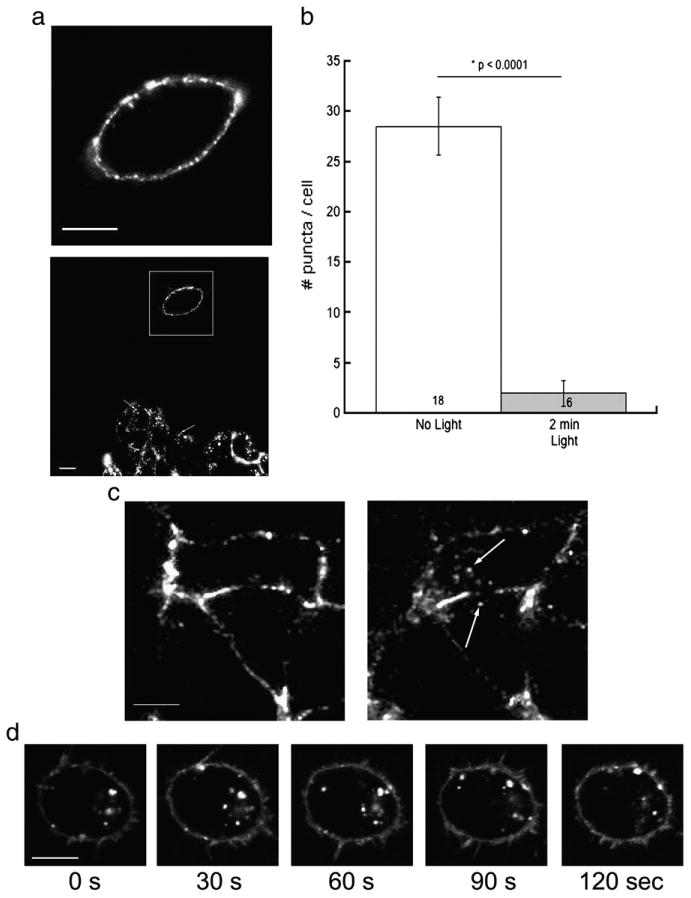
Fluorescence-induced inhibition of internalization but not intracellular movement of labeled receptors. a) Representative confocal image of a HEK-293 cell with labeled surface 5-HT3A/BBS receptors that was exposed to 157.5 mW/cm2 of ∼488 nm light from a 30 mW argon laser every 5 s for 2 min (top image). After 30 min at 37 °C receptor internalization was monitored with reduced magnification to allow visualization of cells examined previously, as well as surrounding cells not previously exposed to light (bottom image). The box indicates the cell imaged for the first 2 min and arrows indicate internal puncta in the unexposed cell. b) The number of internal clusters of BTX/488 that were separate from the cell membrane were counted and averaged per cell. c) Representative confocal image of a HEK-293 cell with labeled surface 5-HT3A/BBS receptors that was exposed to ∼543 nm light for 2 min. After 30 min at 37 °C cells exposed to ∼543 nm light contained internalized receptors. Arrows indicate internalized clusters. d) In HEK-293 cells surface labeled 5-HT3A/BBS receptors were allowed to internalize for 30 min at 37 °C. After 30 min at 37 °C the cells were imaged with 157.5 mW/cm2 of ∼488 nm light for 2 min. Representative images at 30, 60, 90, and 120 s are shown. Note the different positions of the puncta at each time point. Scale bars=10 μm.
