
Fig. 6.
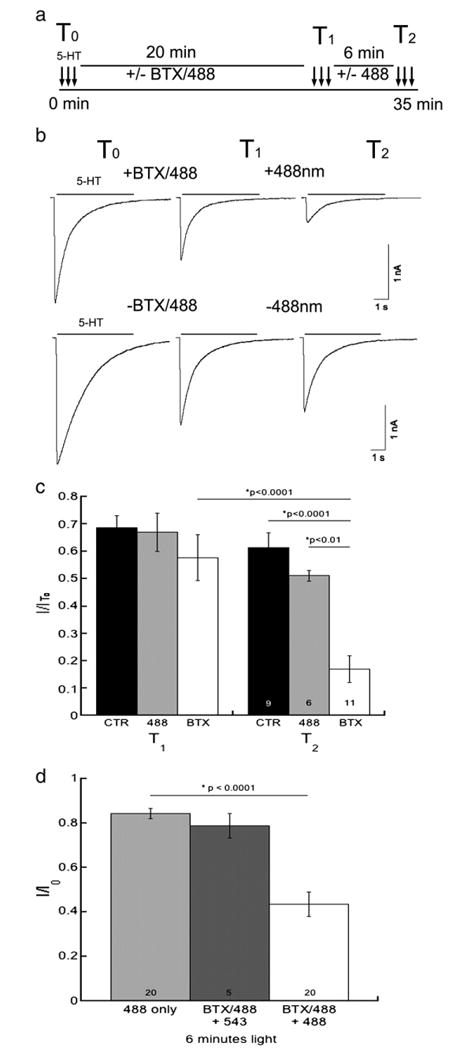
Fluorescent excitation inhibits the function of 5-HT3A/BBS receptors. Whole-cell voltage-clamp electrophysiology was performed on HEK-293 cells stably expressing 5-HT3A/BBS receptors.a)Schematic representation of the protocol used. b) Representative current traces elicited by 30 μM 5-HT at T1, and T2 from a cell exposed to BTX/488 and ∼488 nm light (top traces) or a control cell exposed to neither BTX/488 nor ∼488 nm light (bottom traces). c) Averaged peak current amplitude data expressed as a proportion of the initial peak amplitude (I/I0) at T0 at T1 and T2 for control (CTR), light only (488), and (BTX) cells (n = 6–11). d) HEK cells stably expressing 5-HT3A/BBS receptors were labeled with BTX/488 prior to whole cell voltage clamp electrophysiology. Cells were exposed to 30 μM 5-HT every minute. After a few baseline currents recorded cells were exposed to either ∼488 nm or ∼543 nm light for 6 min. ANOVA analysis with a Tukey HSD post hoc test determined there was a significant reduction in the peak amplitudes of BTX/488 labeled receptors after the exposure to ∼488 nm light for 6 min.