
Figure 3. Ketamine blocks NMDAR spontaneous activity, reduces the level of eEF2 phosphorylation, and strengthens synaptic responses.
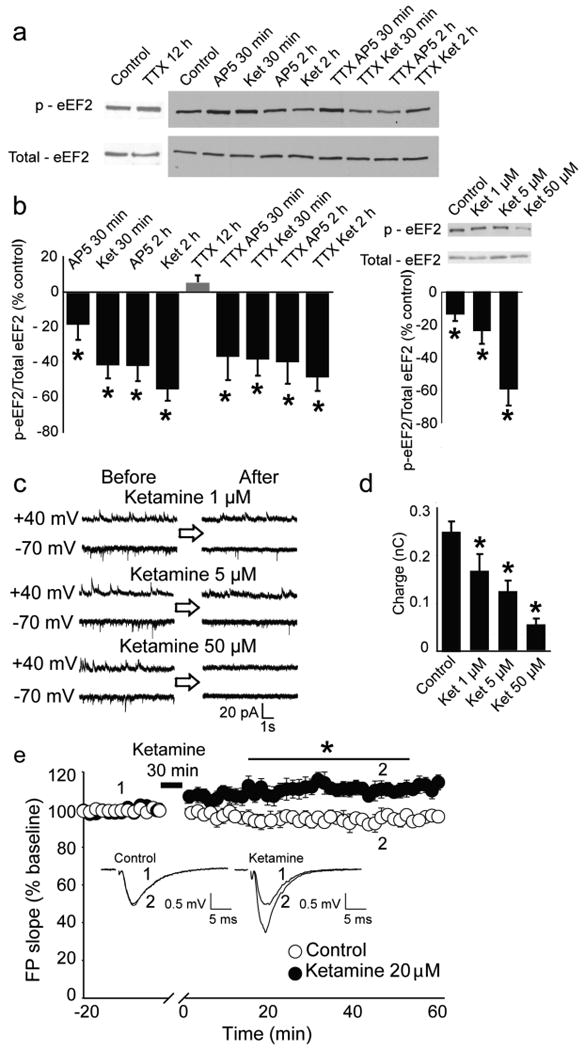
a, Representative western blots from hippocampal primary cultures. b, (left) Densitometric analysis of peEF2 (normalized-total eEF2). Data expressed as mean percentage±SEM. TTX alone does not alter peEF2 while AP5 or ketamine, with or without TTX, significantly decreases peEF2 as assessed by t-test analysis (*P<0.05). (right) Application of 1, 5 and 50 μM of ketamine produces dose-dependent decreases in peEF2 assessed by t-test analysis (*P<0.05). c, Representative traces of NMDAR spontaneous activity after application of 1, 5 and 50 μM. d, Quantification of charge transfer (10 sec) reveals significant effects (*P<0.05) for all ketamine concentrations compared to control (n=6-16) assessed by t-test analysis (*P<0.05). e, Field potential slopes are plotted as a function of time. Representative field potential traces, (average 2-min) are shown during baseline (1) and at 45-min (2). The asterisk refers to significantly different field potentials values (*P<0.05). For statistical analysis we used two-way repeated ANOVA with Bonferroni post-hoc analysis. The drug-time interaction was significant (F143,1430=6.723 P<0.001).