
Figure 4.
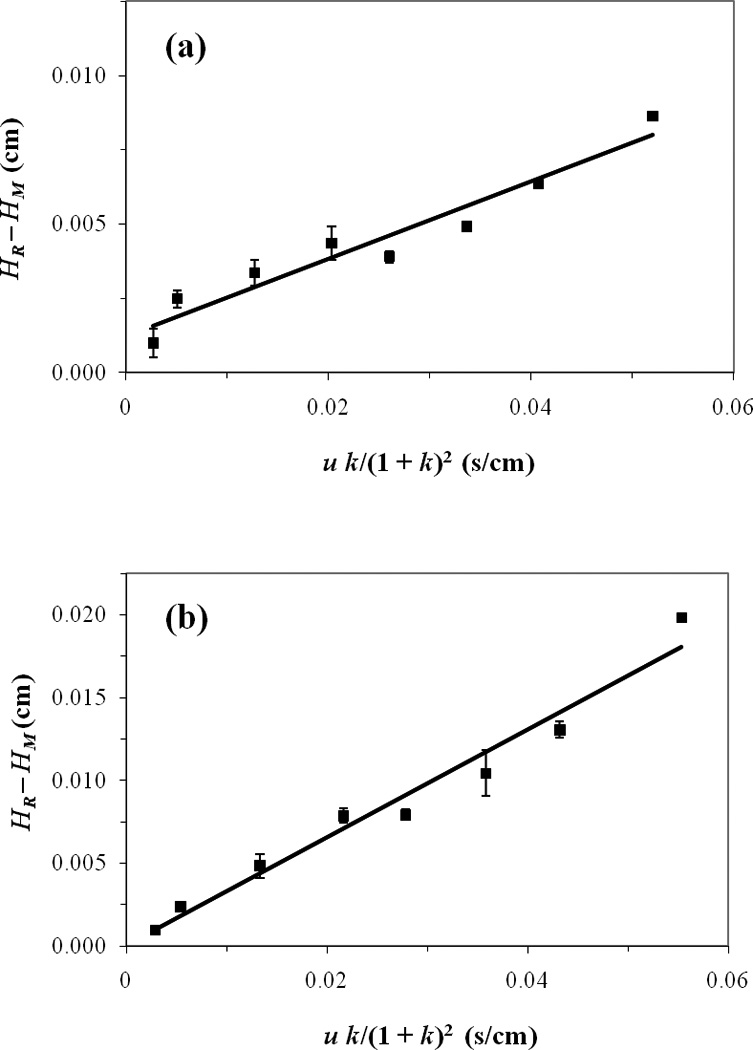
Plots prepared according to Eqs. (4) or (5) in peak profiling studies for the second eluting enantiomers of (a) m-HPPH and (b) p-HPPH on an HSA column. The correlation coefficients for the best-fit lines were 0.966 and 0.974, respectively. The error bars represent a range of ±1 S.D. for triplicate injections (Note: The error bars are often on the same size scale as the data point symbols in these plots).