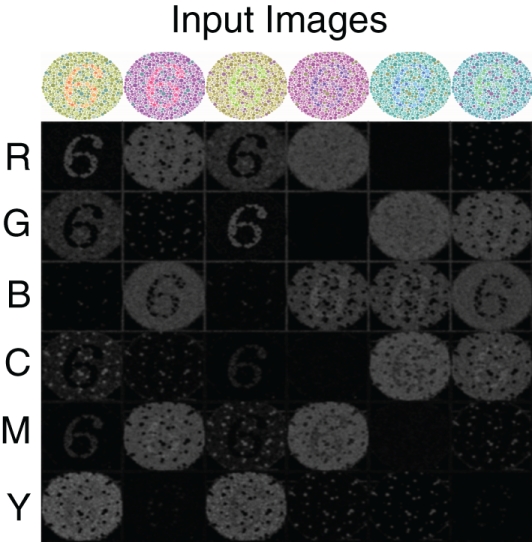
Figure 3.
V4 responses to colorblind test images. Six versions of the same test image with the number 6 are used (top row). The color composition is varied so as to activate different color populations. The response of the six color regions (rows) to the six test images (columns) is shown in gray scale: no response is black and highest response is white. As one can see, under most configurations the number “6” pops-out in the neural responses.

