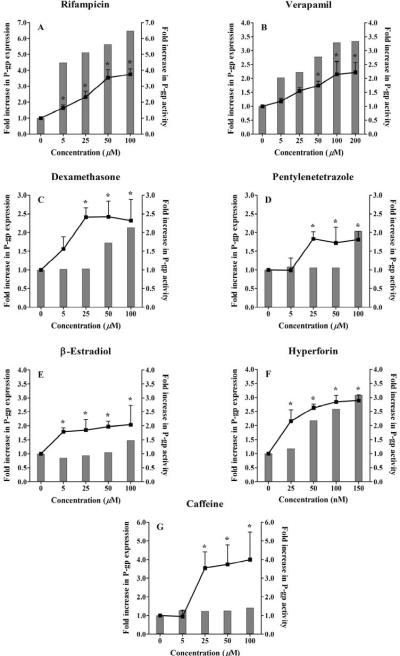
Figure 3.
Effect of treatment of LS-180 cells with increasing concentrations of (A) rifampicin, (B) verapamil, (C) dexamethasone, (D) pentylenetetrazole, (E) β-estradiol, (F) hyperforin, and (G) caffeine, on P-gp expression and activity. Cells were treated for 48 h followed by Western blot analysis for P-gp expression (shown as column bars) and uptake study for P-gp activity (shown as line). P-gp activity was measured as the ratio of intracellular rhodamine 123 fluorescence in the presence and absence of 100 μM verapamil as P-gp inhibitor. The data is expressed as mean ± STD for P-gp activity (n=3–4). P-gp expression was determined for n=2. *P < 0.05.

