
Figure 2.
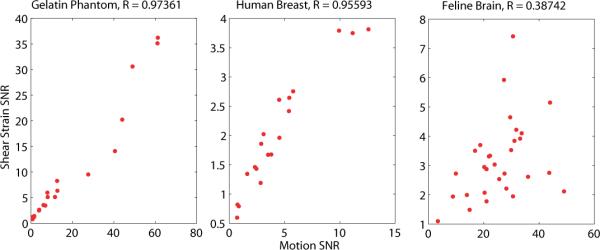
Correlation between shear SNR and motion SNR for three applications. The left plot shows gelatin phantoms, the center plot in vivo human breast, and the right plot shows in vivo feline brain. Pearson's correlation coefficients are given above each plot. Estimates of the mean relative size of the RBM components for all datasets were 25 ± 17% for phantoms, 60 ± 18% for breast data, and 86 ± 19% for feline brain.