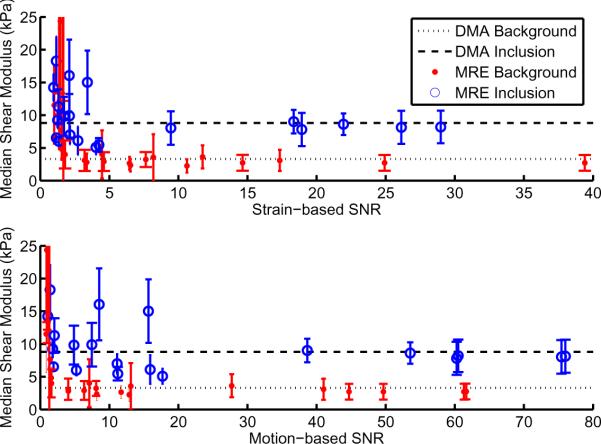
Figure 4.
Quantitative evaluation of subzone MRE background shear modulus estimate with varying strain SNR (upper plot), and motion SNR (lower plot), for a collection of gelatin phantom datasets. Independent DMA measurements at the same frequency (using time-temperature superposition) are shown as dotted lines, the numerical values are 3.3 ± 0.8 kPa, and 8.8 ± 0.9 kPa.

