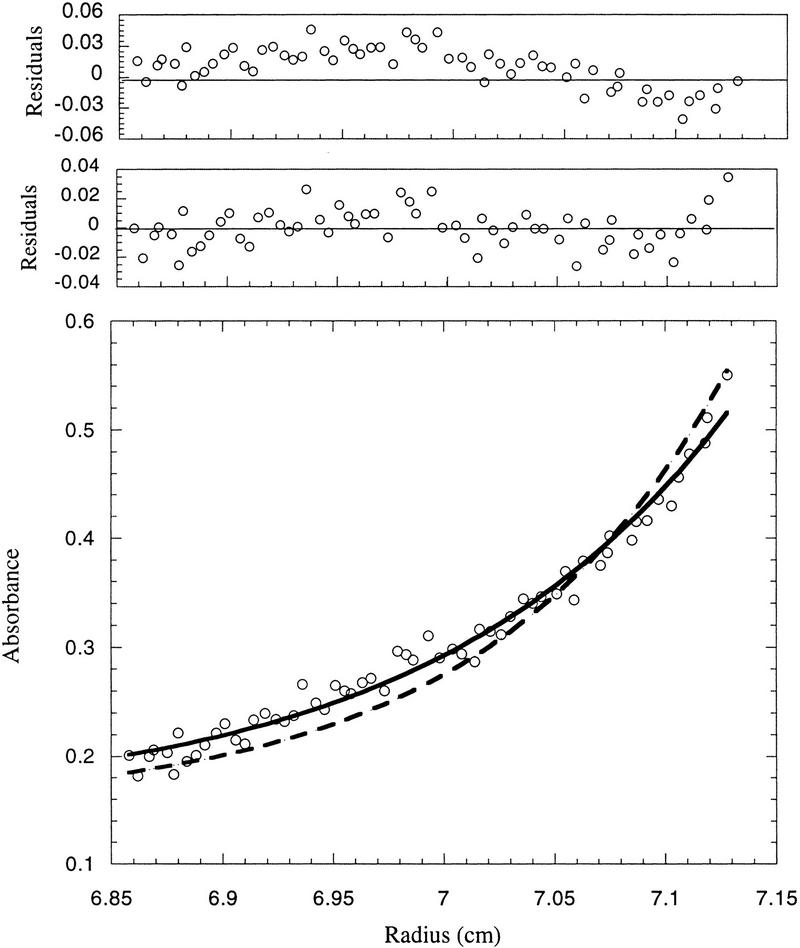
Figure 5.
Determination of the molecular mass of purified p21/cyclin A/Cdk2 complexes. The apparent molecular mass of cyclin A/Cdk2 complex increases from 86 to 105 kD after saturation of the complex with p21. (Bottom) The raw concentration data determined by measuring the absorbance at 280 nm. The solid line drawn through the data points was obtained by fitting the fringe displacement vs. radial position to a single-species model. The dashed line represents the predicted behavior of a 1:1:2 (cyclin A:Cdk2:p21) complex using the same single-species model. (Top panels) The residual differences between the experimental data and the fitted data for each point, with those corresponding to the 1:1:2 model placed above those corresponding to the 1:1:1 model. The purified proteins used for analytical ultracentrifugation are shown in Fig.6. Sedimentation equilibrium analysis was performed at 4°C and a rotor speed of 9,000 rpm.

