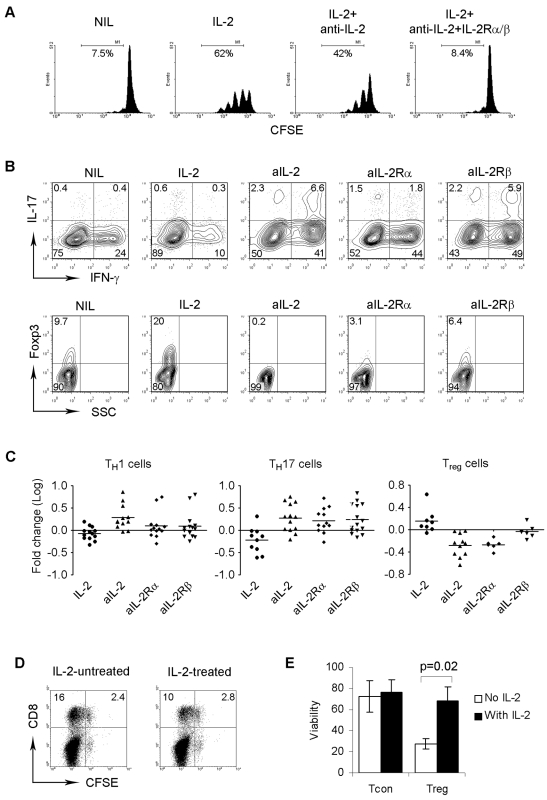
Figure 1.
Effect of IL-2 signaling on differentiation of intratumoral T cells in FL. (A) Representative histograms (n = 3) showing proliferation measured by CFSE staining of T cells treated with IL-2, or anti–IL-2, or anti–IL-2 plus anti–IL-2Rα and anti–IL-2β Abs. Proliferative capacity was expressed by calculating the number of CFSEdim cells. (B) Representative plots (n = 6) showing the expression of IL-17, IFN-γ, or Foxp3 in CD4+ T cells treated with or without IL-2, anti–IL-2, anti–IL-2Rα, or anti–IL-2Rβ Ab. (C) Summary of the numbers of TH1 (CD4+IFN-g+) or TH17 (CD4+IL-17+) or Treg (CD4+Foxp3+) cells induced by IL-2 or anti–IL-2, anti–IL-2Rα, or anti–IL-2Rβ Ab. The induction of TH1 or TH17 or Treg cells was converted to logarithm number. (D) Representative plots (n = 4) showing proliferation measured by CFSE staining of CD8+ T cells cocultured CD4+ T cells pretreated with or without IL-2. (E) Summary of viability measured by annexin/PI assay of CD4+CD25− conventional (Tcon) or CD4+CD25+ regulatory (Treg) T cells treated with or without IL-2 (n = 3).

