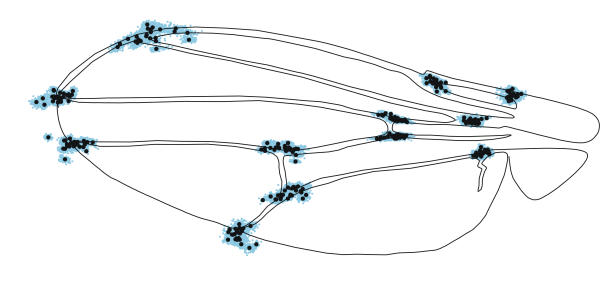
Figure 5.
Aligned species data. Black circles represent the mean locations of landmarks in each species; blue dots are the positions of each of the landmarks in each of the 2406 specimens. The wing used as the basis for the line drawing was chosen to be as close as possible to the tangent or reference configuration.

