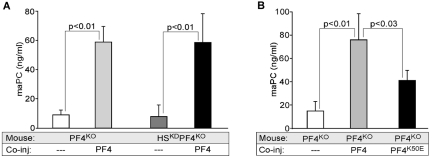
Figure 3.
PF4 stimulation of aPC in vivo in mice plasma after injection of IIa. Mouse aPC measured in plasma after coinjection of IIa (80 U/kg) and PF4 (5 mg/kg). (A) Control and HSKD mice on PF4KO background (n = 5-10 animals per arm). (B) PF4KO mice as in panel A but coinjected with either WT PF4 or PF4K50E (both at 5 mg/kg). Levels of n = 5 to 10 animals per group. Data are mean ± SD.

