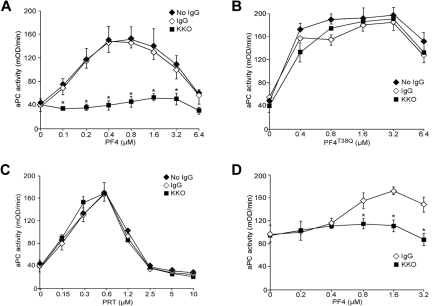
Figure 6.
Effect of KKO on PF4 enhancement of aPC formation. (A) aPC generation study as in Figure 1B, but with 400 μg/mL of KKO or control isotype IgG present. Experiments were done 4 times in duplicate. Data are mean ± SD. *P < .05 vs control IgG. (B) Same as in panel A, but PF4T38Q was used (n = 3, each done in duplicate). (C) Same as in panel A, but PRT at increasing concentration was used (n = 3, each done in duplicate). Data are mean ± SD of 4 experiments. (D) aPC generation study as in Figure 2A, but with 400 μg/mL of KKO or control isotype IgG present. Experiments were done 3 times in duplicate. Data are mean ± SD. *P < .05 vs control IgG.

