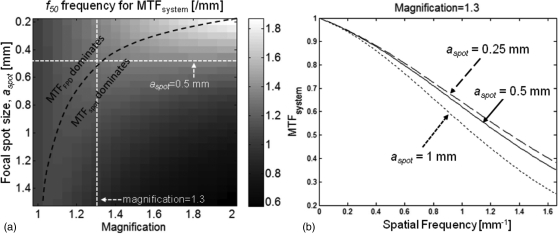
Figure 3.
MTF analyzed as a function of system geometry and focal spot size. (a) Frequency at which MTFsystem = 0.5 (f50) is shown as a function of focal spot size and system magnification. The dashed black line indicates the boundary between the region dominated by detector MTF and the region dominated by focal spot MTF. (b) System MTF plotted for three values of focal spot size at a fixed magnification of 1.3. Reducing the focal spot size below 0.5 mm yields only marginal improvements in MTFsystem, where this combination of magnification factor and focal spot size (marked with white dashed lines in (a)) corresponds to the optimum between regions dominated by MTFFPD and MTFspot.

