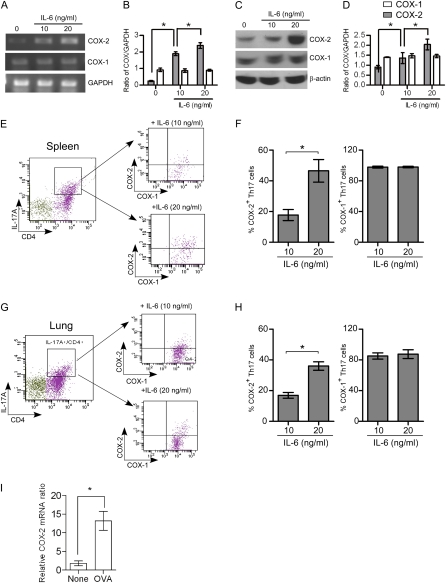
Figure 3.
Regulation of cyclooxygenase (COX)-1 and COX-2 during Th17 cell differentiation from naive CD4+ T cells. Naive CD4+ T cells isolated from spleen were stimulated with or without anti-CD3 (3 μg/ml), anti-CD28 (3 μg/ml), anti–INF-γ (3 μg/ml), transforming growth factor-β (10 ng/ml), and IL-6 (10 or 20 ng/ml) for 4 days to induced Th17 differentiation and then the cells were analyzed for COX-1 and COX-2 expression by real-time polymerase chain reaction (RT-PCR), protein immunoblotting, and flow cytometry. (A) PCR products showing mRNA levels of COX-1, COX-2, and glyceralhehyde phosphate dehydrogenase (GAPDH). (B) COX-1 and COX-2 mRNAs were quantified by densitometry and expressed as the density ratio of COX-1 or COX-2 relative to GAPDH. Results are representative of three independent experiments. (C) Immunoblot analysis of cell lysates for COX-1, COX-2, and β-actin. (D) Protein levels of COX-1 and COX-2 were quantified by densitometry and expressed relative to β-actin. Results are representative of three independent experiments. (E and G) Naive CD4+ T cells were stimulated with anti-CD3, anti-CD28, anti–INF-γ, transforming growth factor-β, and IL-6 (10 and 20 ng/ml) for 4 days, and then stimulated for 4 hours with 12–0-tetradecanoyl-phorbol-13-acetate and ionomycin (500 ng/ml each) in the presence of brefeldin A (1 μg/ml) before intracellular staining with anti-CD4, IL-17, COX-1, and COX-2. Gating on the CD4+ IL-17A+ cell population, COX-1 and COX-2 expression was analyzed by flow cytometry. (F and H) The percent of the COX-1– and COX-2–positive Th17 cells after treatment with different concentrations of IL-6 is shown. Results are representative of three independent experiments. *P < 0.05. (I) Lung CD4+ T cells were isolated after ovalbumin (OVA) exposure in vivo and COX-2 mRNA levels were quantified by RT-PCR; n = 6; *P < 0.01 versus control (no OVA).

