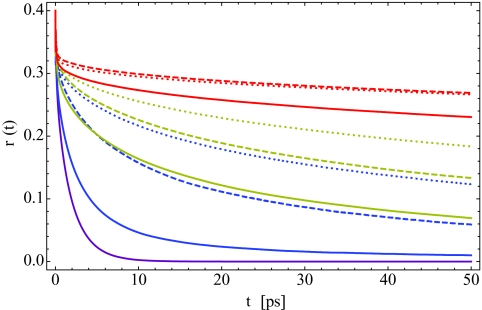
Figure 10.
P2 approximation to the anisotropy decay r(t), from Eq. 2.7, for the same hydration levels as in Fig. 8. The dashed and dotted lines represent contributions from phosphate- and carbonyl-associated waters, respectively, while the solid lines give the water-associated orientational relaxation. The anisotropy decay for HDO in bulk H2O within the P2 approximation is shown as the purple line for reference. For each hydration level, the water-associated molecules have faster orientational relaxation than lipid-associated molecules.

