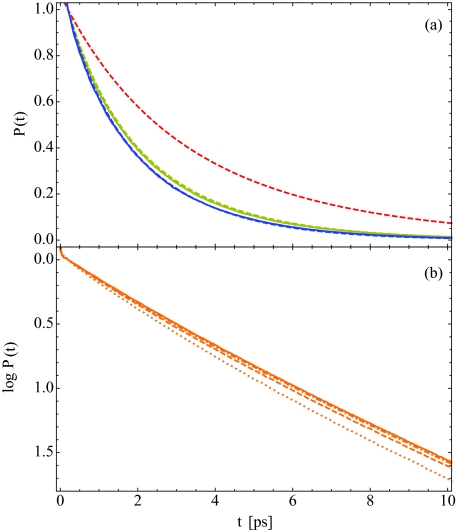
Figure 6.
(a) Theoretical (solid) and experimental (dashed) isotropic pump-probe decay curves, P(t), for hydration levels X = 2 (red), 6 (yellow), and 16 (blue). (b) The isotropic pump-probe decay on a logarithmic scale for hydration level X = 4 as a function of the detection frequency, ω = 2458 (dotted), 2488 (dashed), 2516 (dotted-dashed), and 2546 cm−1 (solid).

