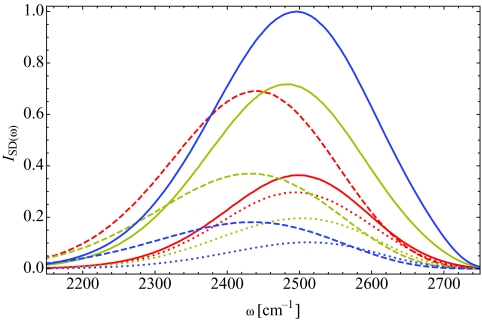
Figure 8.
Spectral density, from Eq. 2.4, for dilute HDO in H2O for X = 2 (red), 6 (yellow), and 16 (blue). The dashed lines indicate contributions from phosphate-associated water molecules, while the dotted lines show contributions from carbonyl-associated waters. The solid line gives the spectral density for water-associated molecules. For all hydration levels, the spectral density due to phosphate-associated waters is red-shifted relative to the water-associated and carbonyl-associated components.

