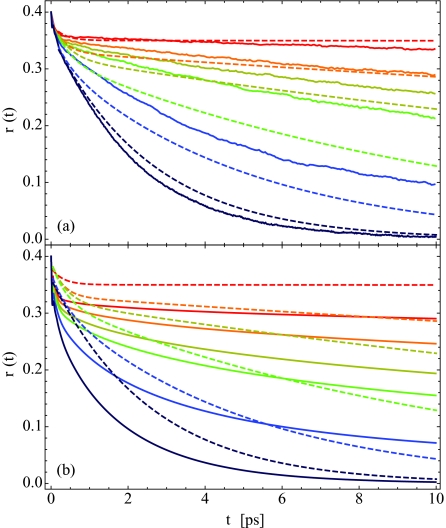
Figure 9.
(a) Theoretical (solid) and experimental (dashed) pump-probe anisotropy decay, r(t), for the same hydration levels as in Fig. 7. The theoretical results are calculated using Eq. 2.5, and are frequency resolved at ωpeak, as given in Table 2. The experimental curves are bi-exponential fits to the anisotropy decay data, as discussed in Table IV and Fig. 8 of Ref. 33. (b) Same, except theory is calculated within the P2 approximation.

