Figure 3.
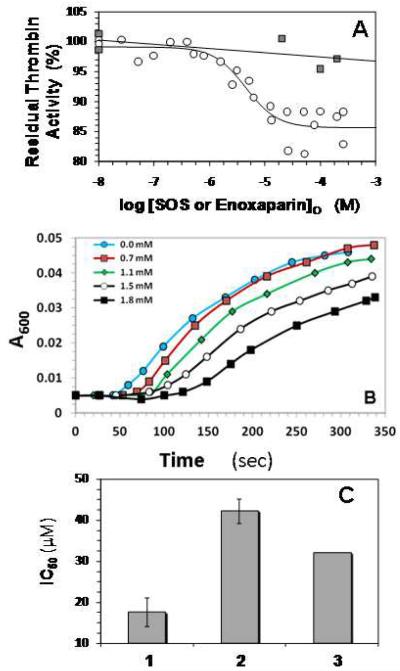
A. Direct inhibition of human α-thrombin by SOS or enoxaparin. Assay conditions were 20 mM sodium phosphate or Tris-HCl buffer, pH 7.4, containing 150 mM NaCl, 0.1% PEG8000 and either 0.1 mM EDTA or 0.1 mM CaCl2 at 25 °C. Thrombin inhibition was measured spectrophotometrically using Spectrozyme TH hydrolysis assay. o = SOS; ■ = enoxaparin. For the SOS data, solid line represents dose-response fit to obtain IC50 and Hill Slope (equation 3), as described in the Experimental Procedures. For the enoxaparin data, solid line is a linear trend line.
B. Fibrinogen Cleavage By Thrombin in the Presence of SOS. The inhibition of HT cleavage of fibrinogen by SOS was followed in time dependent turbidimetric measurement at 600 nm of thrombin catalyzed cleavage of a 40 mg/ml sample of human fibrinogen at different SOS concentrations, as described in Experimental Procedures.
C. Competitive binding of SOS and enoxaparin to human α-thrombin. Thrombin inhibition was performed in the presence of 50 μM enoxaparin in a manner similar to that in its absence and the resulting data were fitted by the dose-response equation to obtain the apparent IC50. 1 = SOS alone; 2 = SOS + 50 μM enoxaparin; 3 = IC50 predicted by Dixon-Webb relationship for ideal competitive binding. Error bars are ±1 S.E. See text for details.

