
Figure 3.
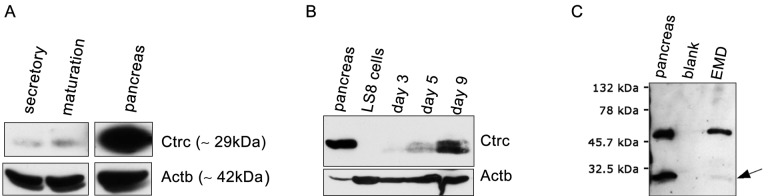
Western blot analysis of Ctrc. (A) Ctrc protein expression level in cells derived from rat incisor enamel organ cells at the secretory and maturation stages. A noticeable increase in Ctrc is observed in the maturation stage relative to the secretory stage. (B) Ctrc protein expression level in cells derived from mouse mandibular first molar teeth at days 3, 5, and 9 and in the ameloblast cell line LS8 derived from newborn mouse molars. There was a significant increase in Ctrc levels as the enamel organ progressed from the secretory stage (day 3) to the maturation stage (day 9). Ctrc expression is absent in LS8 cells. (C) Ctrc expression in the porcine enamel matrix protein derivative (Emdogain® or EMD). A Ctrc-specific band at ˜26-30 kDa (arrow) was identified (C, lane 3; EMD). Ctrc levels in rat and mouse tissues and in EMD are less abundant than the levels of Ctrc seen in the pancreas (C, lane 1). Note that a larger, non-specific band at ˜50 kDa is also apparent for Ctrc (included in C), and these data are consistent with those previously described for Ctrc (Tomomura et al., 1992, 1995).