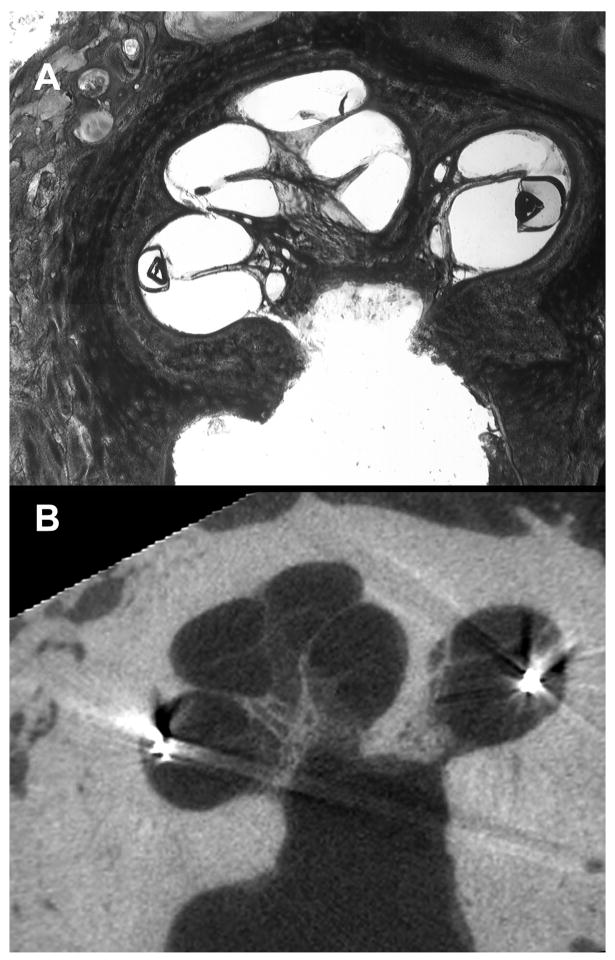
FIG. 4.
Correlation of micro-CT, histology, and clinical CT. We tabulated the position of each part of the electrode array in the histologic sections and depicted them with arrowheads in this figure. The position of each electrode was determined by clinical CT scanning and depicted them with circles. The position of each is shown as depicted in the figure.

