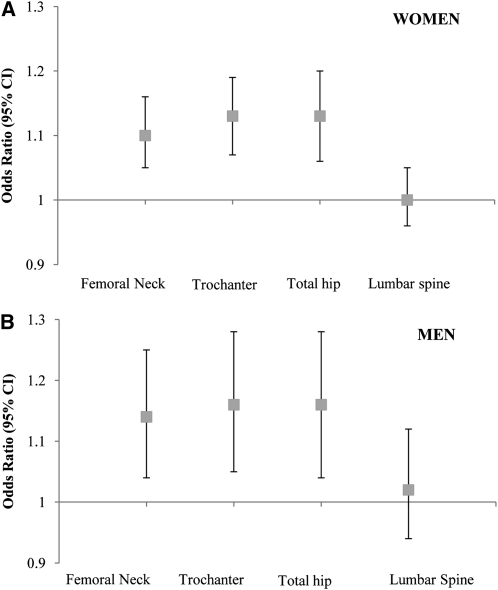
FIGURE 2.
ORs (and 95% CIs) of osteoporosis or osteopenia for every 100-g increase in body weight–adjusted abdominal fat mass in women (n = 465; A) and in men (n = 164; B). Adjusted for age (y), current smoking status (yes or no), education (<9th grade, 9th–12th grade, General Education Development, some college, college, or graduate school), alcohol intake (g/d), energy intake (kcal/d), season of bone mineral density measurement (spring, summer, fall, or winter), osteoporosis prescription medication use (yes or no), physical activity score (%), calcium intake (mg/d), plasma 25-hydroxyvitamin D status (ng/mL), body weight (kg), and height (m) by using logistic regression (PROC LOGISTIC; SAS Institute).

