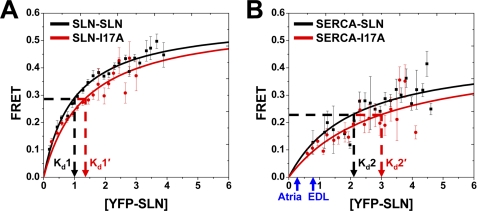
FIGURE 5.
Binding affinity determined by FRET microscopy. A plot of FRET efficiency versus acceptor expression was fit by a hyperbolic binding curve (Eq.2) for each protein-protein interaction. The dissociation constant (Kd) is the YFP-SLN concentration giving half-maximal FRET. A, SLN-SLN (Kd1) and SLN-I17A (Kd1′). B, SERCA-SLN (Kd2) and SERCA-I17A (Kd2′). Symbols indicate mean ± S.E. (n = 6 for SLN-SLN and n = 4 for SERCA-SLN). All four Kd values show pairwise significance (p < 0.01). Blue arrows indicate the relative level of SLN expression in muscle tissue, as reported for mouse heart (Atria) and rabbit fast-twitch muscle (EDL) (57). Based on gel densitometry, the mean SERCA content of Sf21, atria, and EDL homogenates is 0.107 ± 0.025 nmol/mg, 0.090 ± 0.009 nmol/mg (57), and 0.880 ± 0.065 nmol/mg (57), respectively.

