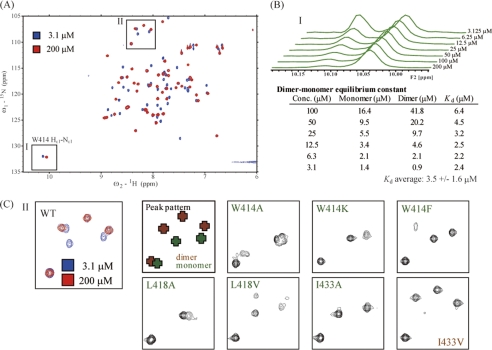
FIGURE 2.
NMR analysis of p62 UBA dimerization. A, 1H-15N HSQC spectra of 15N-labeled WT p62 UBA measured at high (200 μm) and low (3.1 μm) concentrations. B, one dimensional projections of spectral region I in A generated from the 1H-15N HSQC spectra of 15N-labeled WT p62 UBA at various concentrations. The dissociation constant of the p62 UBA dimer was calculated from the populations of monomer and dimer species of the p62 UBA domain at each concentration based on the volume of Trp414 Hϵ1-Nϵ1 side chain peaks of monomer and dimer. C, spectral subregion II in A is magnified, and the same regions of the spectra of various mutants are indicated. All mutants except I433V showed the characteristic monomer cross-peak pattern. I433V maintains the characteristic dimer cross-peak pattern.

