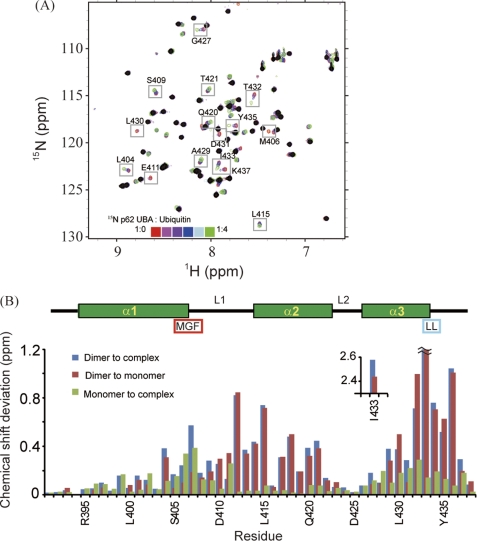
FIGURE 3.
Identification of p62 UBA dimerization interface and ubiquitin-binding site. A, overlay of 1H-15N HSQC spectra of 15N-labeled p62 UBA at low concentration (10 μm) in the absence and presence of different concentrations of ubiquitin. Peaks observed in the 1H-15N HSQC spectrum with a 200 μm sample are masked in black. B, normalized chemical shift changes of backbone amide groups are plotted in a function of amino acid residues. The secondary structures are shown schematically on the top. The position of the MGF motif and the di-leucine motif is also indicated. Normalized chemical shift changes are calculated by (δH2 + (δN/5)2)1/2, where δH and δN represent the chemical shift differences in the 1H and 15N dimensions.

