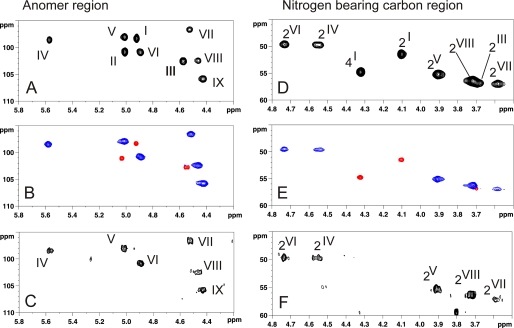
FIGURE 2.
13C,1H HSQC NMR spectra of HF-PS from planktonic and biofilm phases of B. cereus ATCC 14579. Shown are the anomer regions (A–C) and nitrogen-bearing carbon regions (E–F) of 13C,1H HSQC spectra of intact HF-PS from planktonic phase (A and D), Ne HS-PS and Ch HF-PS fractions generated by mild hydrolysis from planktonic phase (B and E), and 24-h biofilm phase (C and F). In B and E, blue signals correspond to Ne HS-PS, and red signals to Ch HF-PS from planktonic phase.

