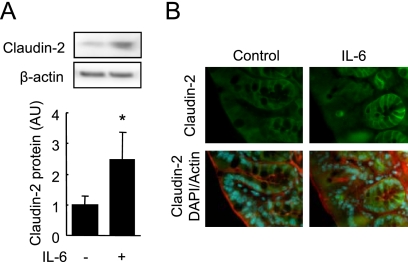
FIGURE 3.
IL-6 induced claudin-2 expression in vivo. Mice were intraperitoneally injected with IL-6 or PBS (vehicle). Colonic mucosae were immunoblotted for claudin-2 and β-actin (A), and cryosections (8 μm in thickness) of colon were triple-labeled for claudin-2 (green), actin (red), and total DNA (blue) (B). Specific bands for claudin-2 were quantitated by densitometric analysis (A). Values represent the mean ± S.E. (n = 4). *, p < 0.05 relative to the control value.

