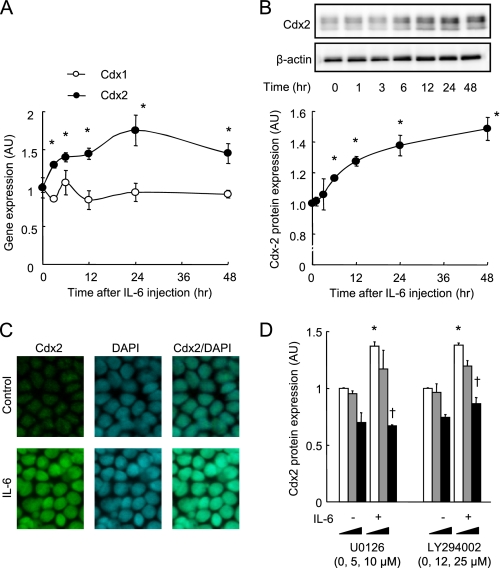
FIGURE 7.
IL-6 induces Cdx2 expression in Caco-2 cells. A and B, Caco-2 cell monolayers were incubated with IL-6 (10 ng/ml) for 48 h. Cdx1 and Cdx2 mRNA expression was quantified with qPCR (A), and Cdx2 protein expression quantified with immunoblotting in cell monolayers before incubation and 3, 6, 12, 24, 48 h after incubation with 10 ng/ml IL-6. Specific bands for Cdx-2 were quantitated by densitometric analysis. *, p < 0.05 relative to 0 h. C, cell monolayers incubated in the absence or presence of IL-6 (10 ng/ml) were double-labeled for Cdx2 (green) and total DNA (blue). D, whole cell extracts of Caco-2 cell monolayers incubated in IL-6-free medium or in medium containing 10 ng/ml IL-6 in the absence or presence of signaling inhibitors (U0126, a MEK inhibitor; LY294002, a PI3K inhibitor) for 48 h were immunoblotted for Cdx2. Specific bands for Cdx-2 were quantitated by densitometric analysis. *, p < 0.05 relative to control without inhibitors. †, p < 0.05 relative to IL-6 without inhibitors. Values represent the mean ± S.E. (n = 4).

