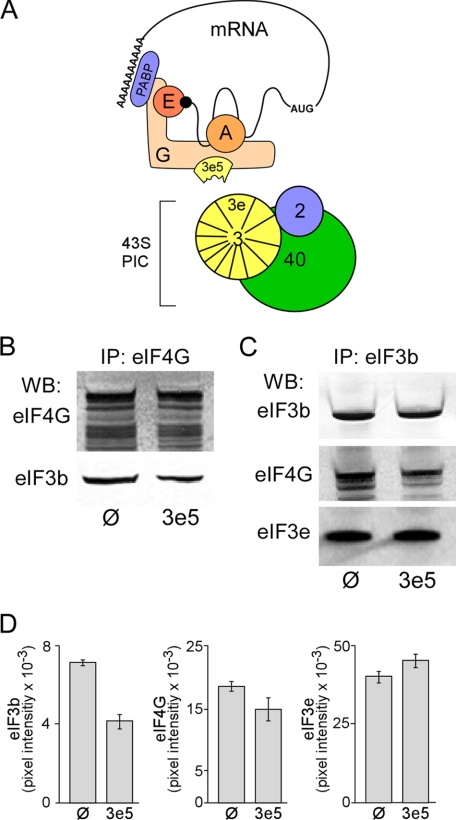
FIGURE 2.
Expression of 3e5 antagonizes the interaction between eIF4G and eIF3. A, model for competition between truncated eIF3e (residues 1–157; 3e5) and eIF3 for binding to eIF4G. 3e5 is depicted as a fragment of eIF3e that retains the ability to bind eIF4G (G) and prevents recruitment of mRNAs to the 43 S preinitiation complex (PIC), inhibiting cap-dependent translation. 2, eIF2; 3, eIF3; 3e, eIF3e; A, eIF4A; E, eIF4E; PABP, the poly(A)-binding protein; 40, 40 S ribosomal subunit. B, immunoprecipitation (IP) of extracts from 3T3-Ø (Ø) and 3T3–3e5 (3e5) cells with anti-eIF4G antibodies. Western blotting (WB) was performed with anti-eIF4G (upper panel) or anti-eIF3b (lower panel) antibodies. C, IP as in B except with anti-eIF3b antibodies. WB was performed with anti-eIF3b (upper panel), anti-eIF4G (middle panel), or eIF3e (lower panel) antibodies. D, quantification of initiation factor subunits. Left, the eIF3b bands detected by WB in B were quantified by ImageQuant software and normalized by the eIF4G signal. Average of six experiments. p < 0.001. Middle, the eIF4G bands detected in C were quantified and normalized by the eIF3b signal. Average of four experiments. p < 0.04. Right, the eIF3e bands detected in C were quantified and normalized by the eIF3b signal. Average of four experiments. p = 0.2. Error bars represent S.E.

