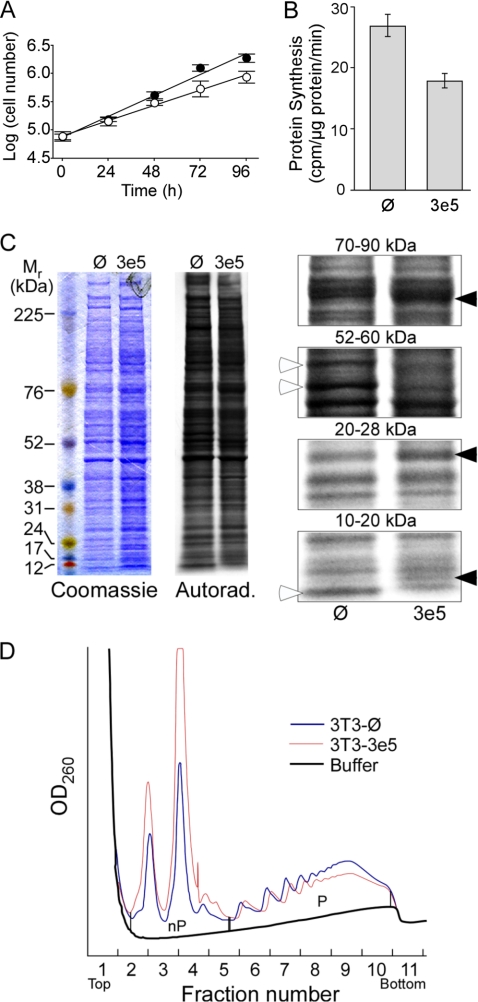
FIGURE 3.
Expression of 3e5 alters growth and protein synthesis in NIH3T3 cells. A, logarithmic growth of 3T3-Ø (filled circles) and 3T3–3e5 (open circles) cells. Equal numbers of cells were seeded on 35-mm plates and counted every 24 h. B, rate of protein synthesis. 3T3-Ø and 3T3–3e5 cells were cultured to 70–80% confluency and then labeled for 30 min with [35S]Met. Preliminary experiments showed that incorporation of radioactivity into trichloroacetic acid-insoluble increased linearly over this period. C, differential expression of proteins in 3T3-Ø and 3T3–3e5 cells. The same labeled cell extracts used in B (2 × 10⁵ cpm) were separated by SDS-PAGE on a 4–12% gel, stained with Coomassie Blue (left), and labeled proteins detected by autoradiography for 24 h (middle). Portions of the autoradiogram are enlarged (right). Open arrowheads indicate proteins labeled more strongly in 3T3-Ø cells. Closed arrowheads indicate proteins labeled more strongly in 3T3–3e5 cells. D, analysis of ribosomal subunit distribution between the nonpolysomal fraction (nP) and polysomes (P). Extracts of 3T3-Ø (black trace) and 3T3–3e5 (red trace) cells were subjected to ultracentrifugation for 2 h. Peaks at fractions 2.5, 3.5, and 4.5 were shown by qRT-PCR to be 40 S subunits, 60 S subunits, and 80 S monosomes, respectively.

