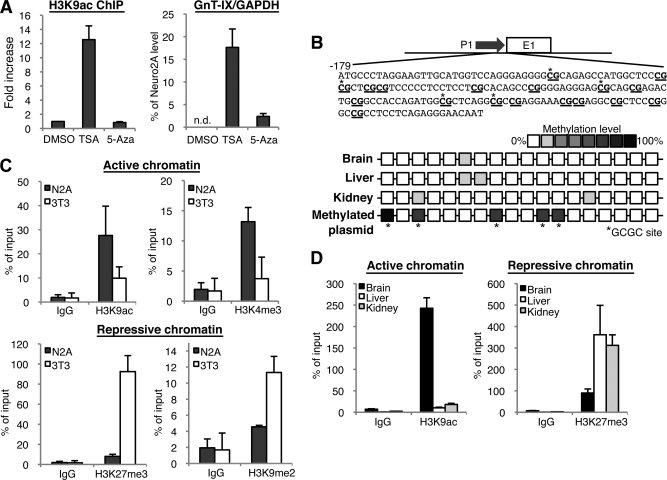
FIGURE 2.
Neural-specific chromatin activation in the GnT-IX core promoter. A, 3T3-L1 cells were treated with DMSO (vehicle), 0.1 μm TSA or 2.5 μm 5-Aza for 24 h, and then ChIP using anti-H3K9ac antibody (left) or real-time PCR (right) was performed. For detection of ChIP, precipitated GnT-IX core promoter region including the TSS (about 200 bp) was amplified and quantified by real-time PCR. In the left graph, relative amounts of precipitated DNA to that of DMSO-treated sample were shown as the mean ± S.E. (n = 3). In the right graph, the amounts of GnT-IX mRNA relative to GAPDH were quantified by real-time PCR. Expression levels are shown as the mean ± S.E. of the ratio to that in Neuro2A cells (n = 3). In DMSO-treated 3T3-L1 cells, endogenous expression of GnT-IX mRNA was not detected. B, methylation levels of GnT-IX promoter from mouse tissues were analyzed by bisulfite sequencing. Schematic representation of GnT-IX promoter (−179 to −1) was shown in which CpG sites are underlined. Eight clones were selected and sequenced from each tissue. Methylation levels are shown as color density. The same analysis was performed for a control GnT-IX promoter construct, which had been methylated by HhaI (bottom). In most clones HhaI-recognition GCGC sites were methylated. C, ChIP experiments were performed with anti-H3K9ac, anti-H3K4me3 (upper), or H3K27me3, H3K9me2 (lower). The same region of the GnT-IX promoter was amplified as A. Amount of precipitated DNA was quantified by real-time PCR. Relative percentage against 1% input sample is shown. Data are presented as the mean ± S.E. (n = 3). D, ChIP experiments similar to those in C were performed using chromatin from 10-week-old C57BL/6 mouse tissues (brain, liver, and kidney). Data are presented as the mean ± S.E. (n = 3).

