FIGURE 4.
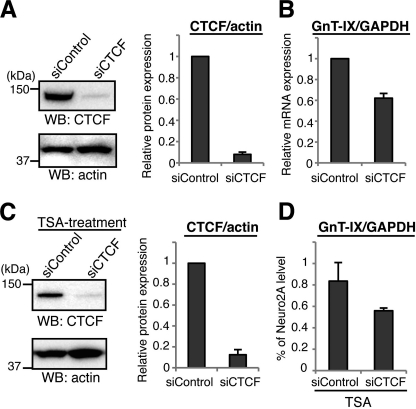
Knockdown of CTCF down-regulates GnT-IX transcription. A, CTCF was knocked down in Neuro2A cells by siRNA transfection. Cells were lysed and then subjected to Western blotting with anti-CTCF or anti-actin antibody (left). The bars represent the relative immunoreactivities of CTCF to actin, shown as the mean ± S.E. (n = 3) (right). B, under CTCF-depleted conditions, the levels of GnT-IX and GAPDH mRNA were quantified by real-time PCR. The expression levels of GnT-IX were normalized to the corresponding GAPDH levels, and the relative level to that of control sample is shown as the mean ± S.E. (n = 3). C, 3T3-L1 cells were transfected with control- or CTCF-specific siRNA before TSA treatment. 24 h after TSA addition, levels of CTCF and actin as a control were examined by Western blotting (left). The bars represent the relative immunoreactivities of CTCF to actin shown as the mean ± S.E. (n = 3) (right). D, levels of GnT-IX mRNA after TSA treatment relative to those of GAPDH were quantified by real-time PCR. Levels of GnT-IX are shown as a percentage relative to that of Neuro2A cells under normal conditions. Data are presented as the mean ± S.E. (n = 3).

