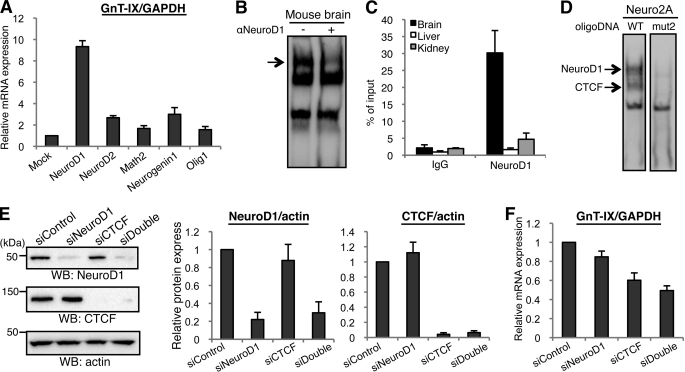
FIGURE 5.
Identification of NeuroD1 as a positive regulator of GnT-IX transcription. A, series of neural bHLH transcription factors (NeuroD1, NeuroD2, Math2, Neurogenin1, or Olig1) were overexpressed in Neuro2A cells and then GnT-IX mRNA was quantified by real-time PCR relative to GAPDH mRNA. Relative expression levels to that of the mock transfected cells are shown as the mean ± S.E. (n = 3). B, EMSA experiments were performed using nuclear extracts from mouse brain and biotinylated oligonucleotide probe (from −82 to −44 in P1) in the presence or absence of anti-NeuroD1 antibody. An arrow indicates reduced signal intensity in the right lane. C, ChIP was performed with anti-NeuroD1 antibody using various mouse tissues. Real-time PCR was performed to quantify the amount of precipitated GnT-IX core promoter region. Relative percentage against 1% input sample is shown as the mean ± S.E. (n = 3). D, nuclear extracts of Neuro2A cells that had been transfected with NeuroD1 expression plasmid were prepared. EMSA was performed using two kinds of biotinylated oligonucleotide probe (from −82 to −44 in P1). In mut2 oligonucleotide, the E-box sequence and CTCF recognition site were completely disrupted. Arrows indicate the loss of NeuroD1 and CTCF binding to the mutated oligonucleotide. E, Neuro2A cells were transfected with NeuroD1 siRNA or CTCF siRNA, or co-transfected with NeuroD1 and CTCF siRNAs. Cells were lysed and then subjected to Western blotting with anti-NeuroD1, anti-CTCF or anti-actin antibody. The bars represent the immunoreactivities of NeuroD1 or CTCF relative to actin, shown as the mean ± S.E. (n = 3) (middle and right). F, under NeuroD1-, CTCF- or double-depleted conditions, relative levels of GnT-IX mRNA to those of GAPDH were quantified. Data are presented as the mean ± S.E. (n = 3).

