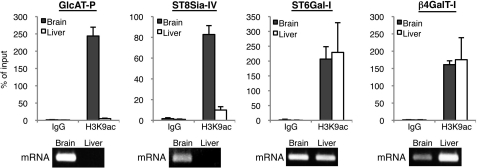
FIGURE 6.
Chromatin activation analysis of other neural glycosyltransferases. Genomic regions around the TSSs of four glycosyltransferase genes were subjected to ChIP analysis with anti-H3K9ac (active chromatin mark) antibody using 20-week-old mouse brain or liver (top). Real-time PCR was performed to quantify the amount of precipitated DNA. Relative percentage against 1% input sample is shown. Data are presented as the mean ± S.E. (n = 3). mRNA level of each glycosyltransferase in adult mouse brain or liver was analyzed by RT-PCR (bottom).

