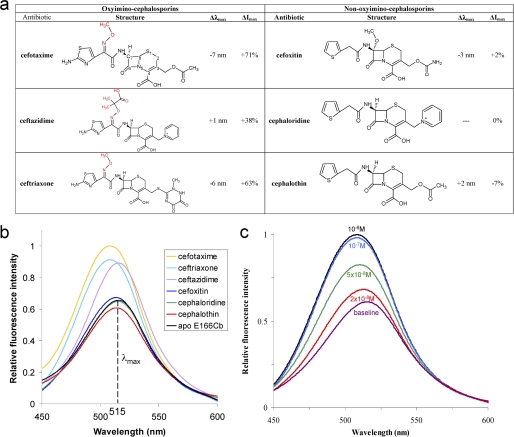
FIGURE 2.
The fluorescence profile of PenP-E166Cb toward diverse cephalosporins. a, fluorescence profile of PenP-E166Cb in the presence of selected cephalosporins at 0.1 mm. Δλmax refers to the shift in wavelength at maximum emission intensity. ΔImax refers to change in emission intensity at λmax. b, fluorescence scanning spectra of PenP-E166Cb (10−7 m) in the presence of the 6 listed cephalosporins (10−4 m), respectively. c, fluorescence scanning spectra of PenP-E166Cb (10−7 m) in the presence of cefotaxime at different concentrations.

