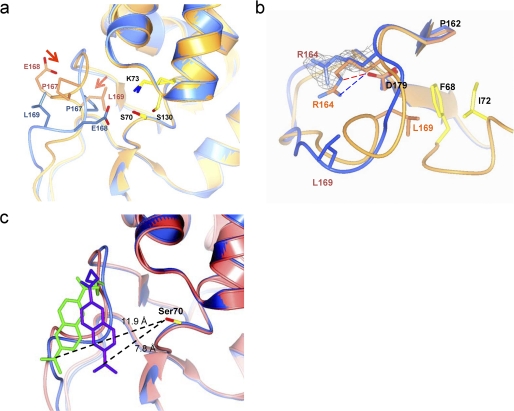
FIGURE 3.
The structure of PenP-E166Cb. a, structure of BADAN-labeled PenP-E166Cb reveals an altered conformation of the Ω-loop. Structures of PenP-E166Cb and wild-type PenP (PDB ID 4BLM) are shown in blue and orange, respectively. Residues on Ω-loop (E166, E166Cb, and P167) and key catalytic residues for acylation (Lys-73, Ser-70, and Ser-130) are displayed in cpk color scheme. The BADAN fluorophore is omitted for clarity purpose. The arrows indicate the induced conformational change of certain residues. b, altered conformation of the Ω-loop is less-stabilized. The Ω-loop of PenP-E166Cb (shown in blue) is aligned with the corresponding region in the wild-type PenP structure (shown in orange). The salt bridge and the hydrogen bond between residues Arg-164 and Asp-179 in the wild-type structure are indicated by dashed lines. The residues forming favorable hydrophobic interaction with Leu-169 (Phe-68 and Ile-72) in the wild-type structure are colored in cpk scheme in the wild-type structure but colored blue in the PenP-E166Cb structure. The fo-fc density for residue Arg-164 in PenP-E166Cb structure is shown in mesh format and contoured at 2.0 σ. c, superposition of the two PenP-E166Cb molecules in the asymmetric unit by aligning all the protein atoms. Ser-70 is shown in cpk. The two BADAN molecules are colored purple and green, respectively. The two superimposed PenP-E166Cb molecules are colored pink and blue, respectively. The distances between the dimethyl group of the BADAN molecule and the -OH of Ser-70 are shown.

