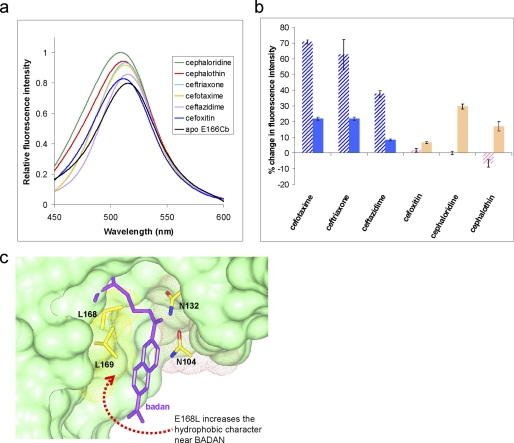
FIGURE 6.
The fluorescence profile of PenP-E166Cb with E168L mutation. a, fluorescence scanning spectra of PenP-E166Cb-E168L in the presence of the 6 listed cephalosporins at 0.1 mm concentration respectively. b, histogram presentation of the fluorescence profile of PenP-E166Cb-E168L (solid pattern) in comparison to that of PenP-E166Cb (hashed pattern). c, the modeled docking groove of BADAN molecule on the surface of PenP-E166Cb-E168L structure. BADAN and the residues lining up the groove are presented in stick model. The surface profile of the residues is presented as mesh model and colored according to their polarity (yellow: hydrophobic; red: acidic; pink: polar).

