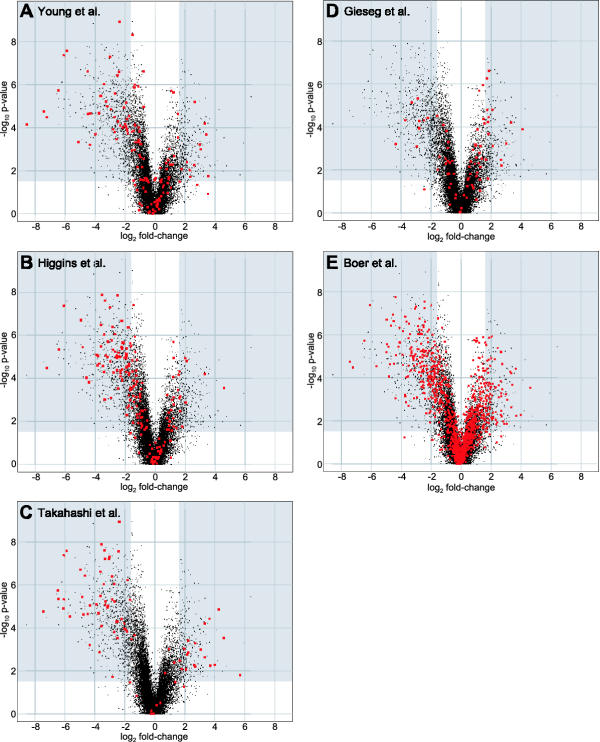
Figure 4.
Our observations of genes identified as being differentially expressed in other studies of RCC gene expression. The 20,000 genes for which we measured significant sequence-specific hybridization are plotted in each scatter plot as a function of the fold change between the tumor and adjacent normal tissue (log2, on the x-axis) and the statistical significance of the change (-log10, on the y-axis). In each panel, our observations of genes identified as being differentially expressed in the indicated study are highlighted in red.

