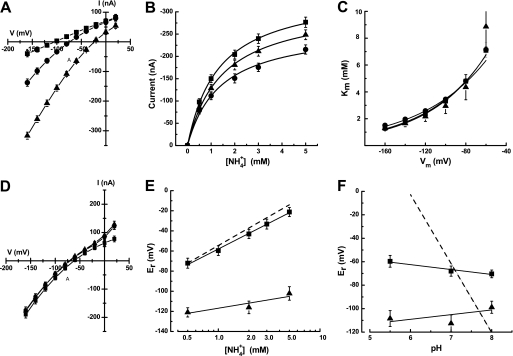
FIGURE 5.
Transport properties of the PvAMT1;1H211E mutant. A, current-voltage plots from oocytes expressing the PvAMT1;1H211E mutant exposed to zero (■), 0.5 (●), and 5.0 (▴) mm NH4+ at pH 5.5. B, ammonium transport kinetics of the PvAMT1;1H211E mutant at pH 5.5 (■), 7.0 (▴), and 8.0 (●). The lines correspond to the fitted Michaelis-Menten equation to the experimental data (symbols). C, voltage dependence of the Km at pH 5.5 (■), 7.0 (▴), and 8.0 (●). D, current-voltage plots from oocytes expressing the PvAMT1;1H211E mutant exposed to 1 mm NH4+ at pH 5.5 (■), 7.0 (▴), and 8.0 (●). E, reversal potentials recorded at different ammonium concentrations from oocytes expressing PvAMT1;1H211E (■) and control DEPC/H2O-injected oocytes (▴). F, reversal potentials recorded at three different extracellular pH values from oocytes expressing PvAMT1;1H211E in the presence (■) or in the absence (▴) of 1 mm NH4+. In E and F, the dashed lines represent the relationship according to the Nernst equation. Data are the means ± S.D. from more at least eight oocytes from three different frogs.

